
Individual Third Party Dashboard
A third party's dashboard brings together everything StyxView knows about one third party. To open it, select the third party's name under Third Party Risk in the sidebar, or select its row on the Third Parties page. While you are on its pages, the third party's name and logo appear in the top bar.
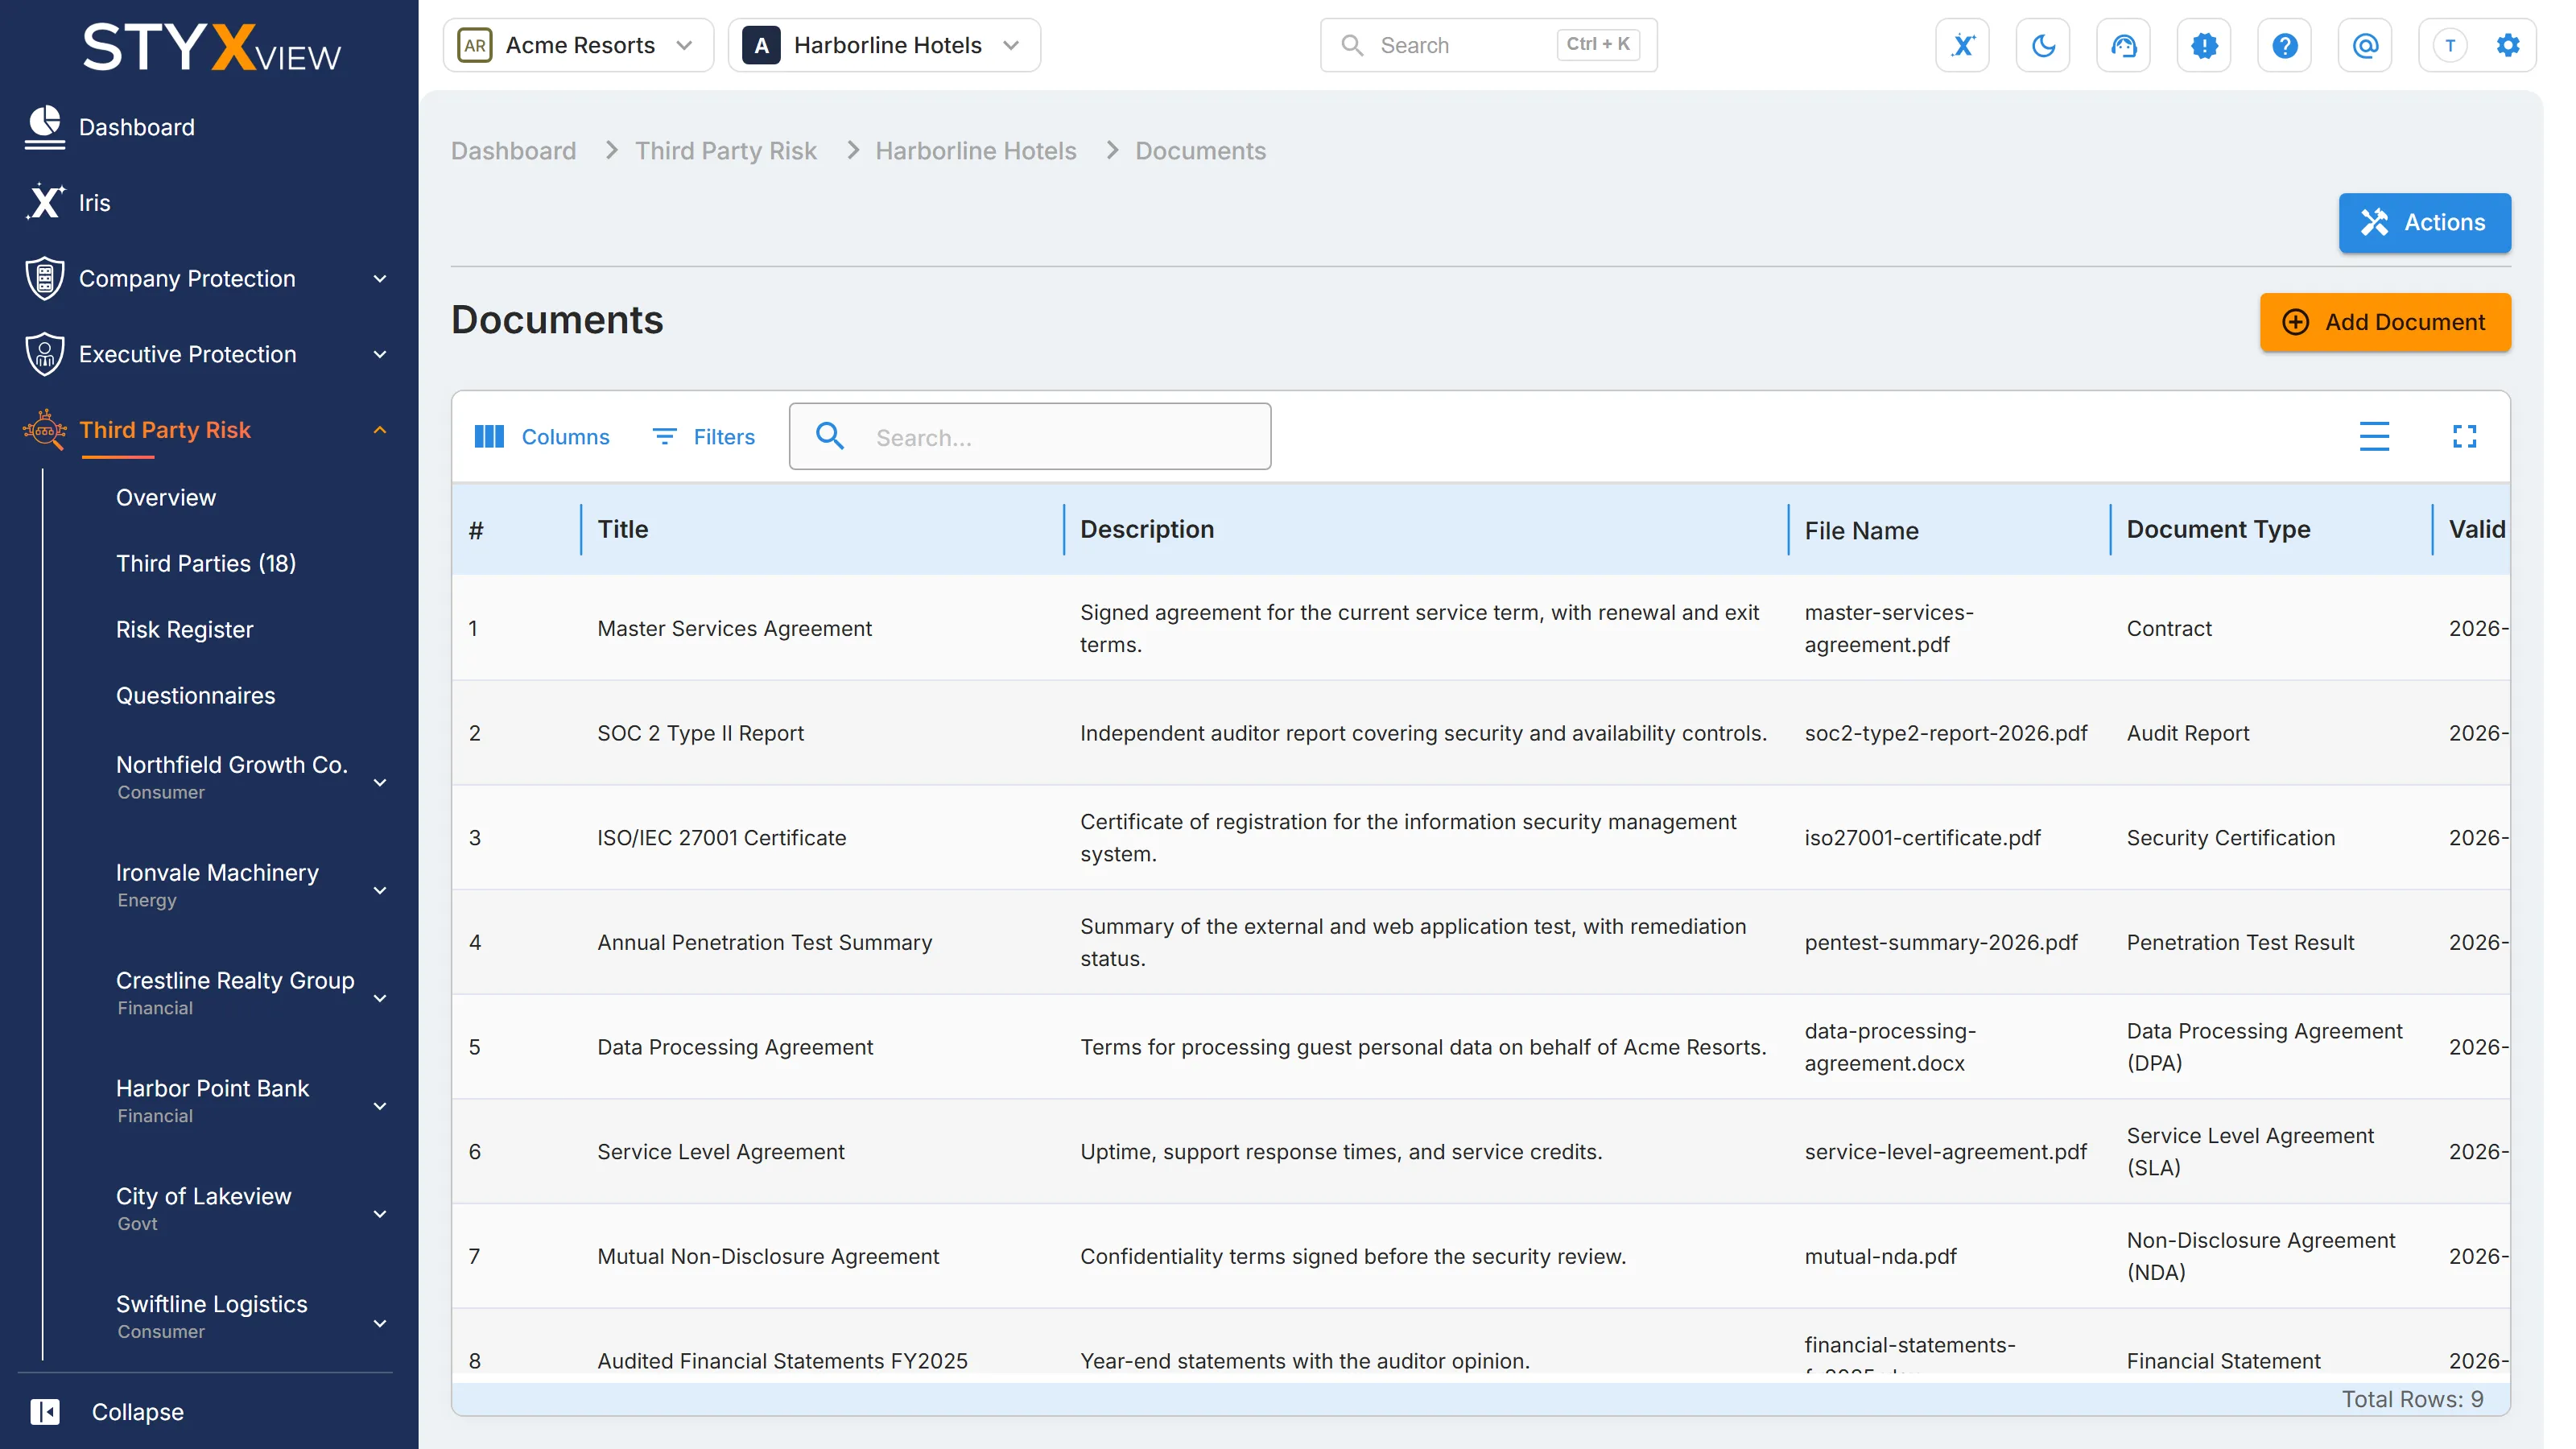
The third party's entry in the sidebar also holds its other pages: "Overview" (this dashboard), "Risk Score", "Assets", "Risks" (including its "Risk Register" and the detection pages such as "Data Leakage & Dark Web Detection" and "Lookalike Domains"), and "Documents".
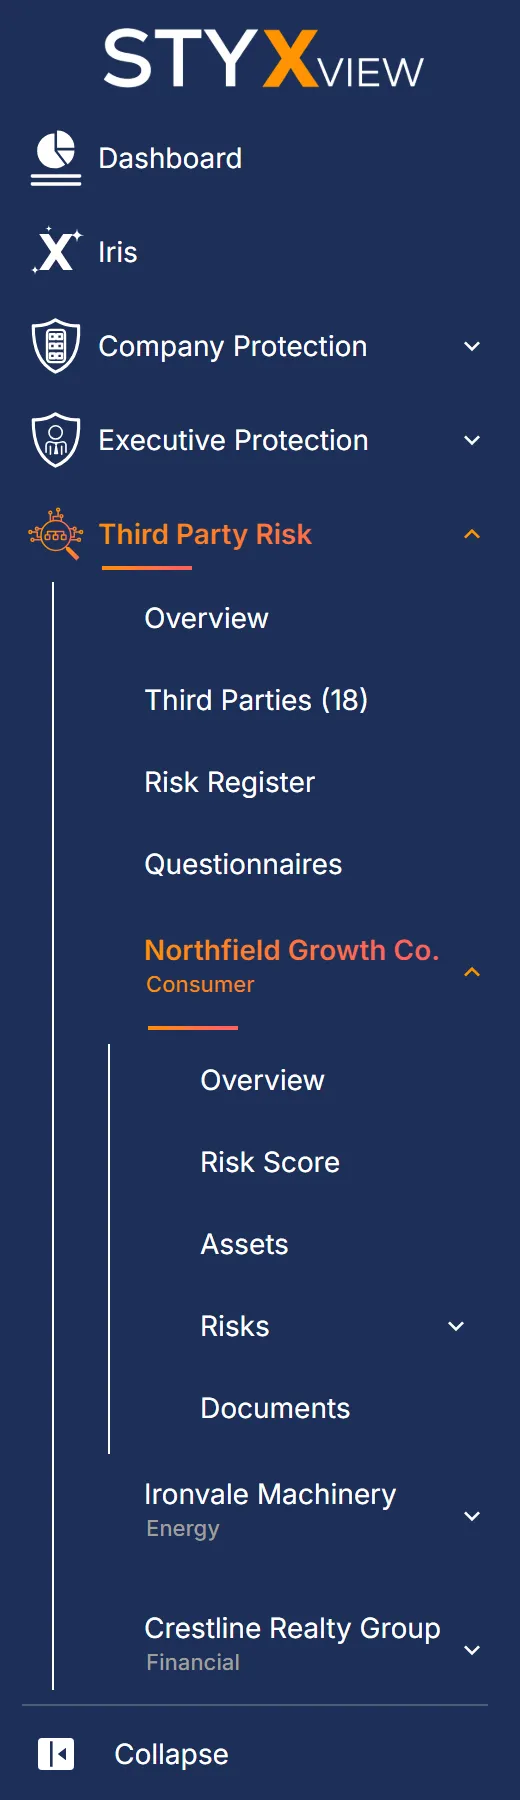
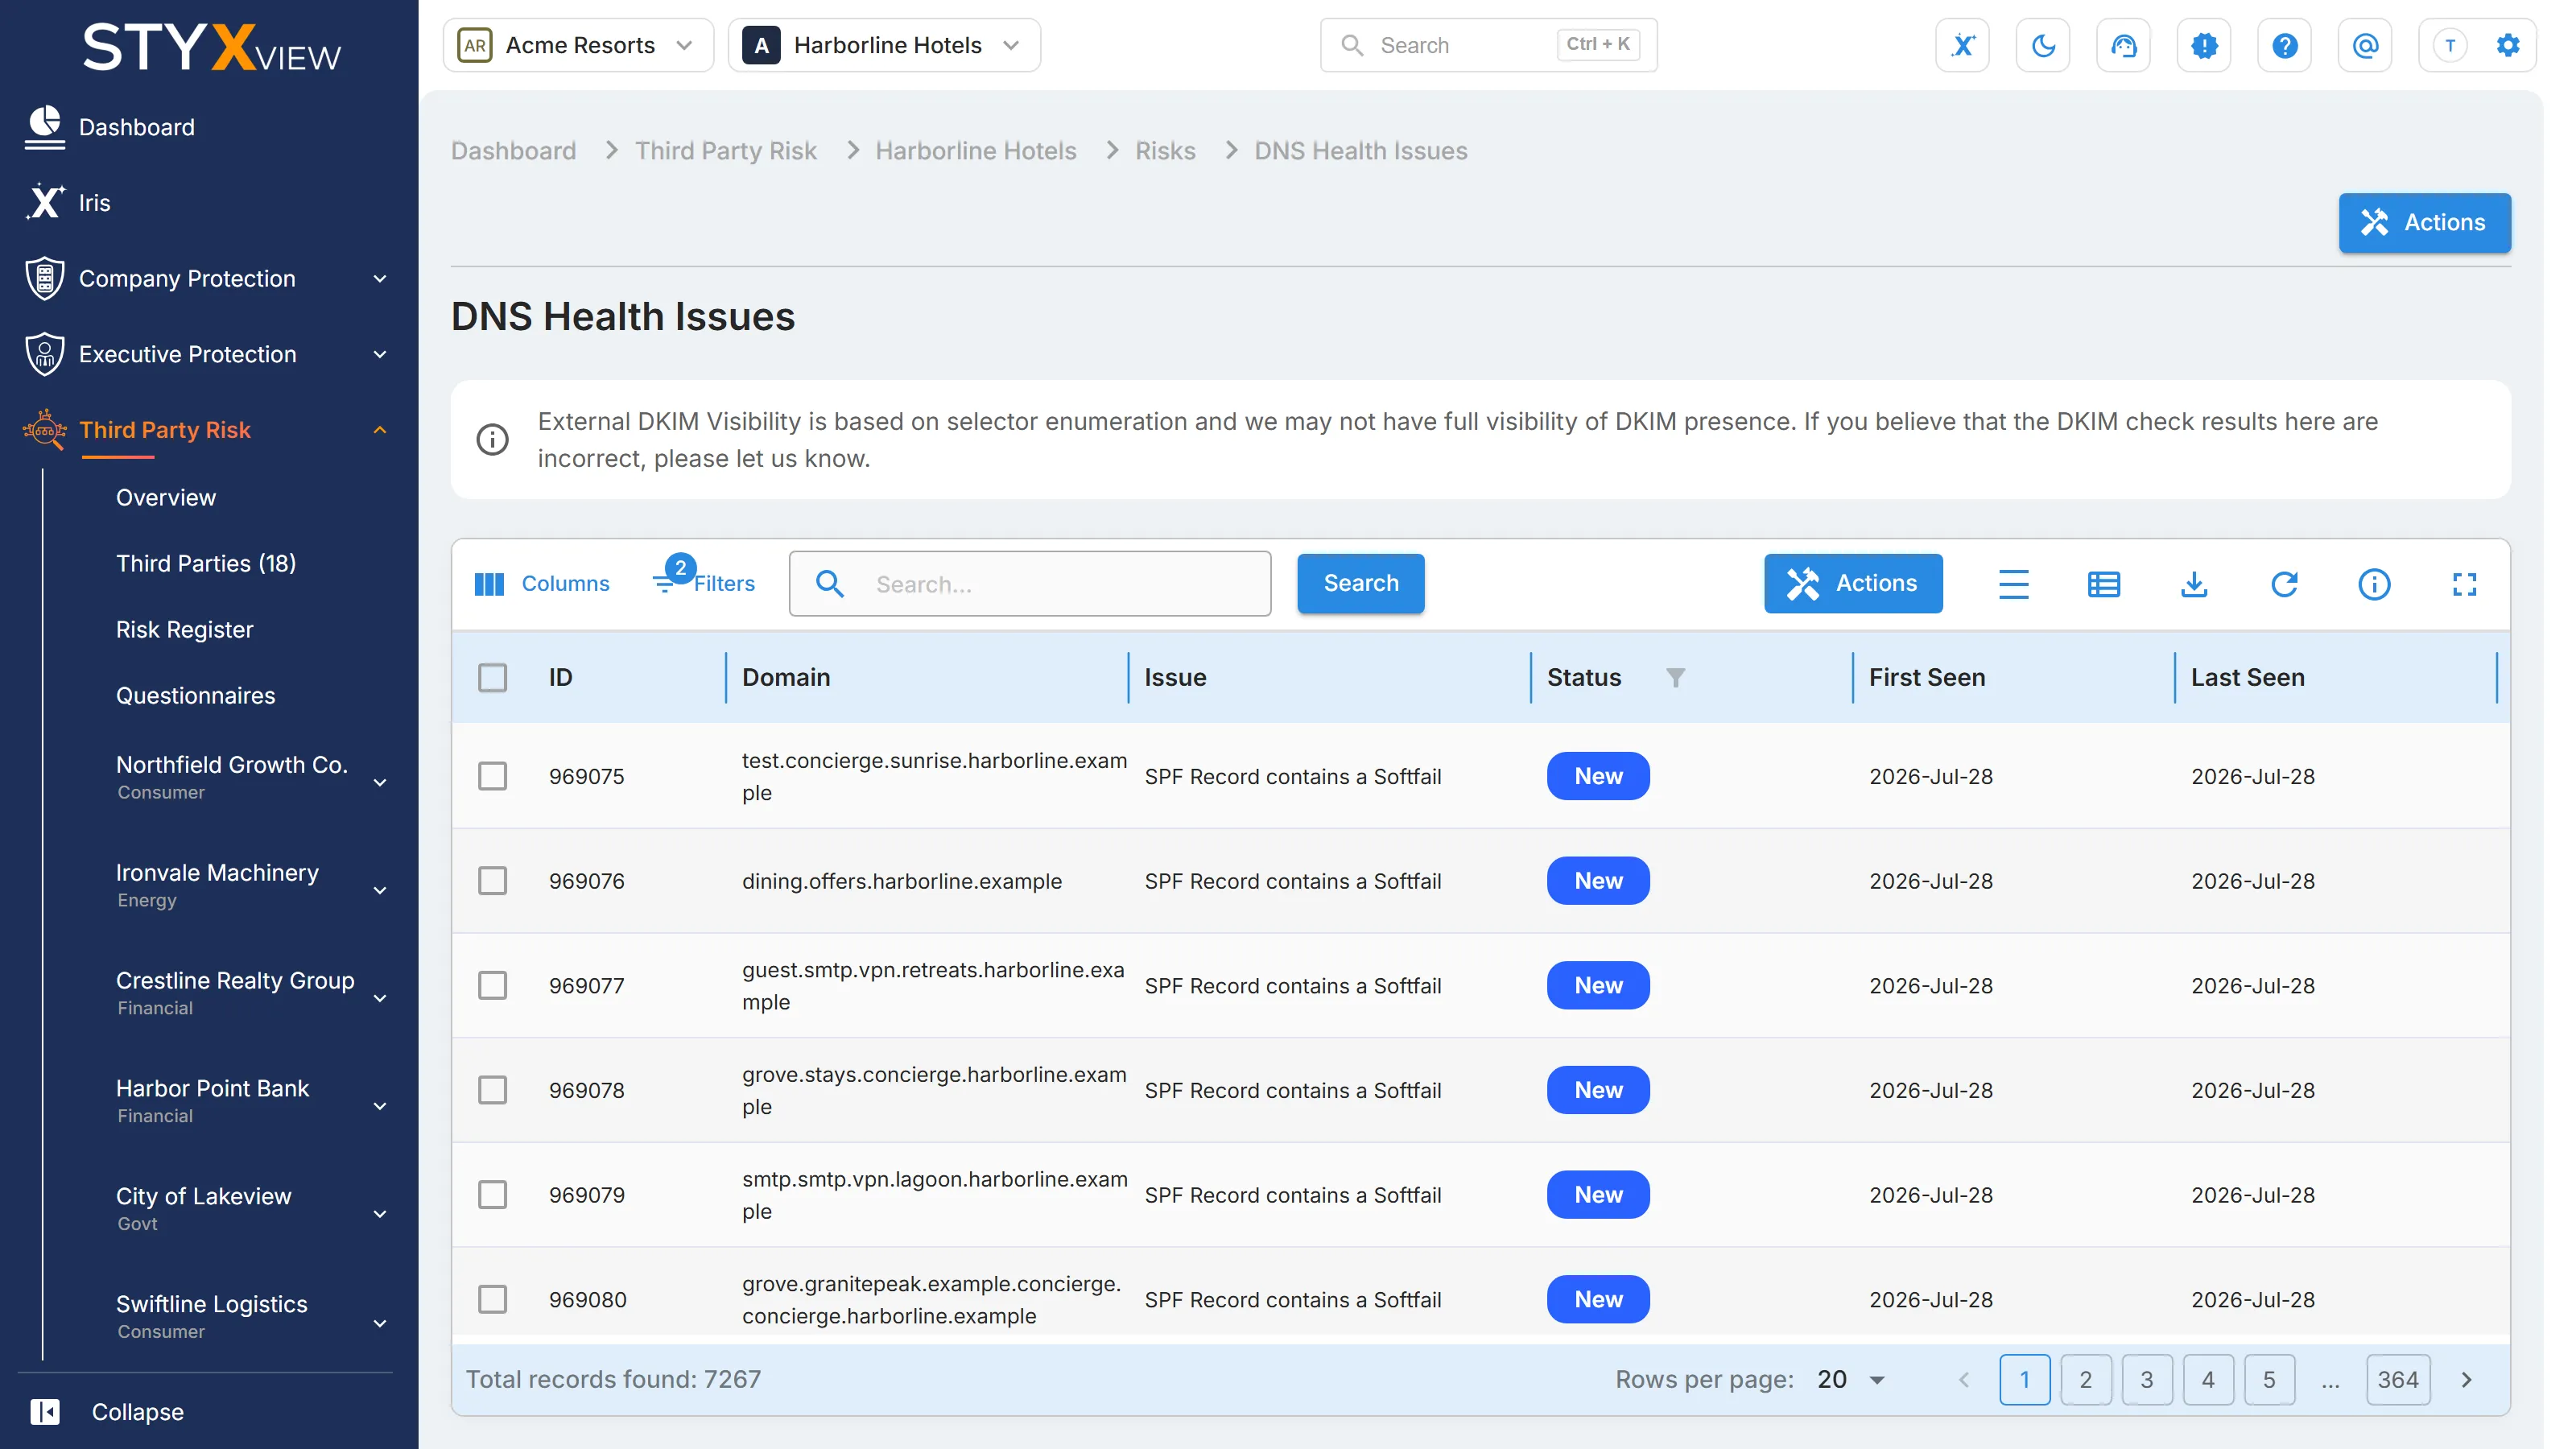
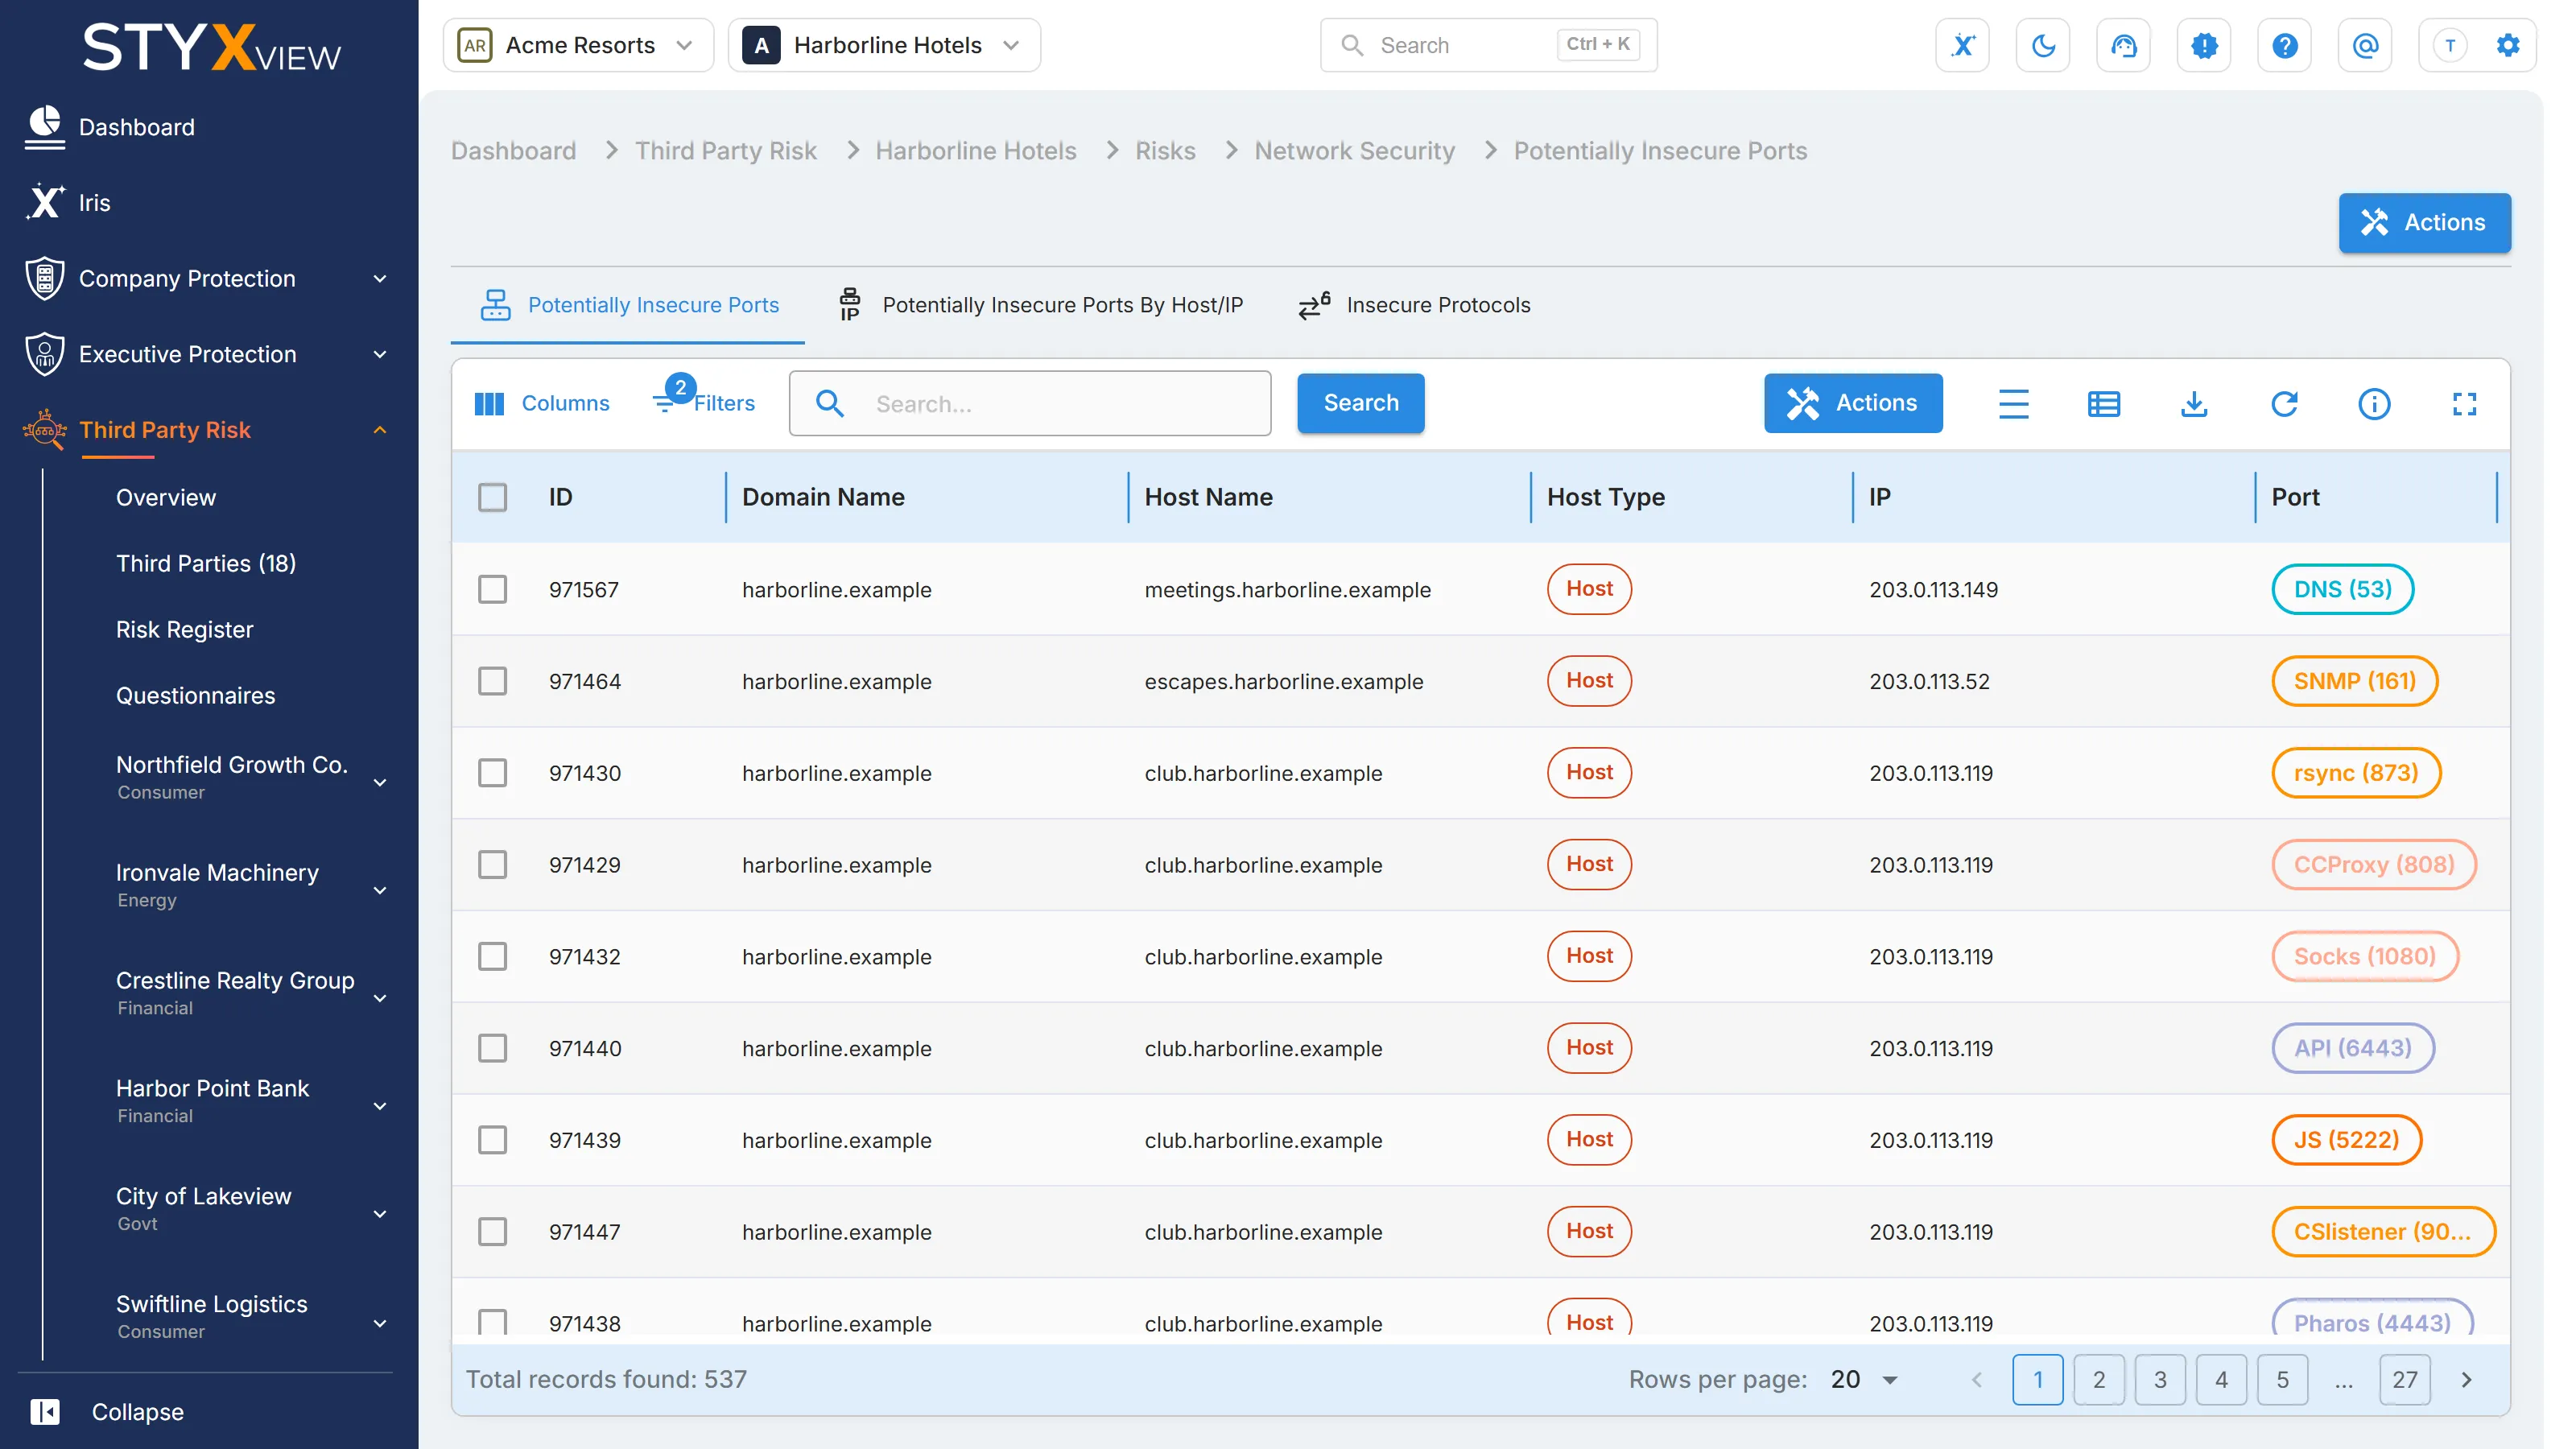
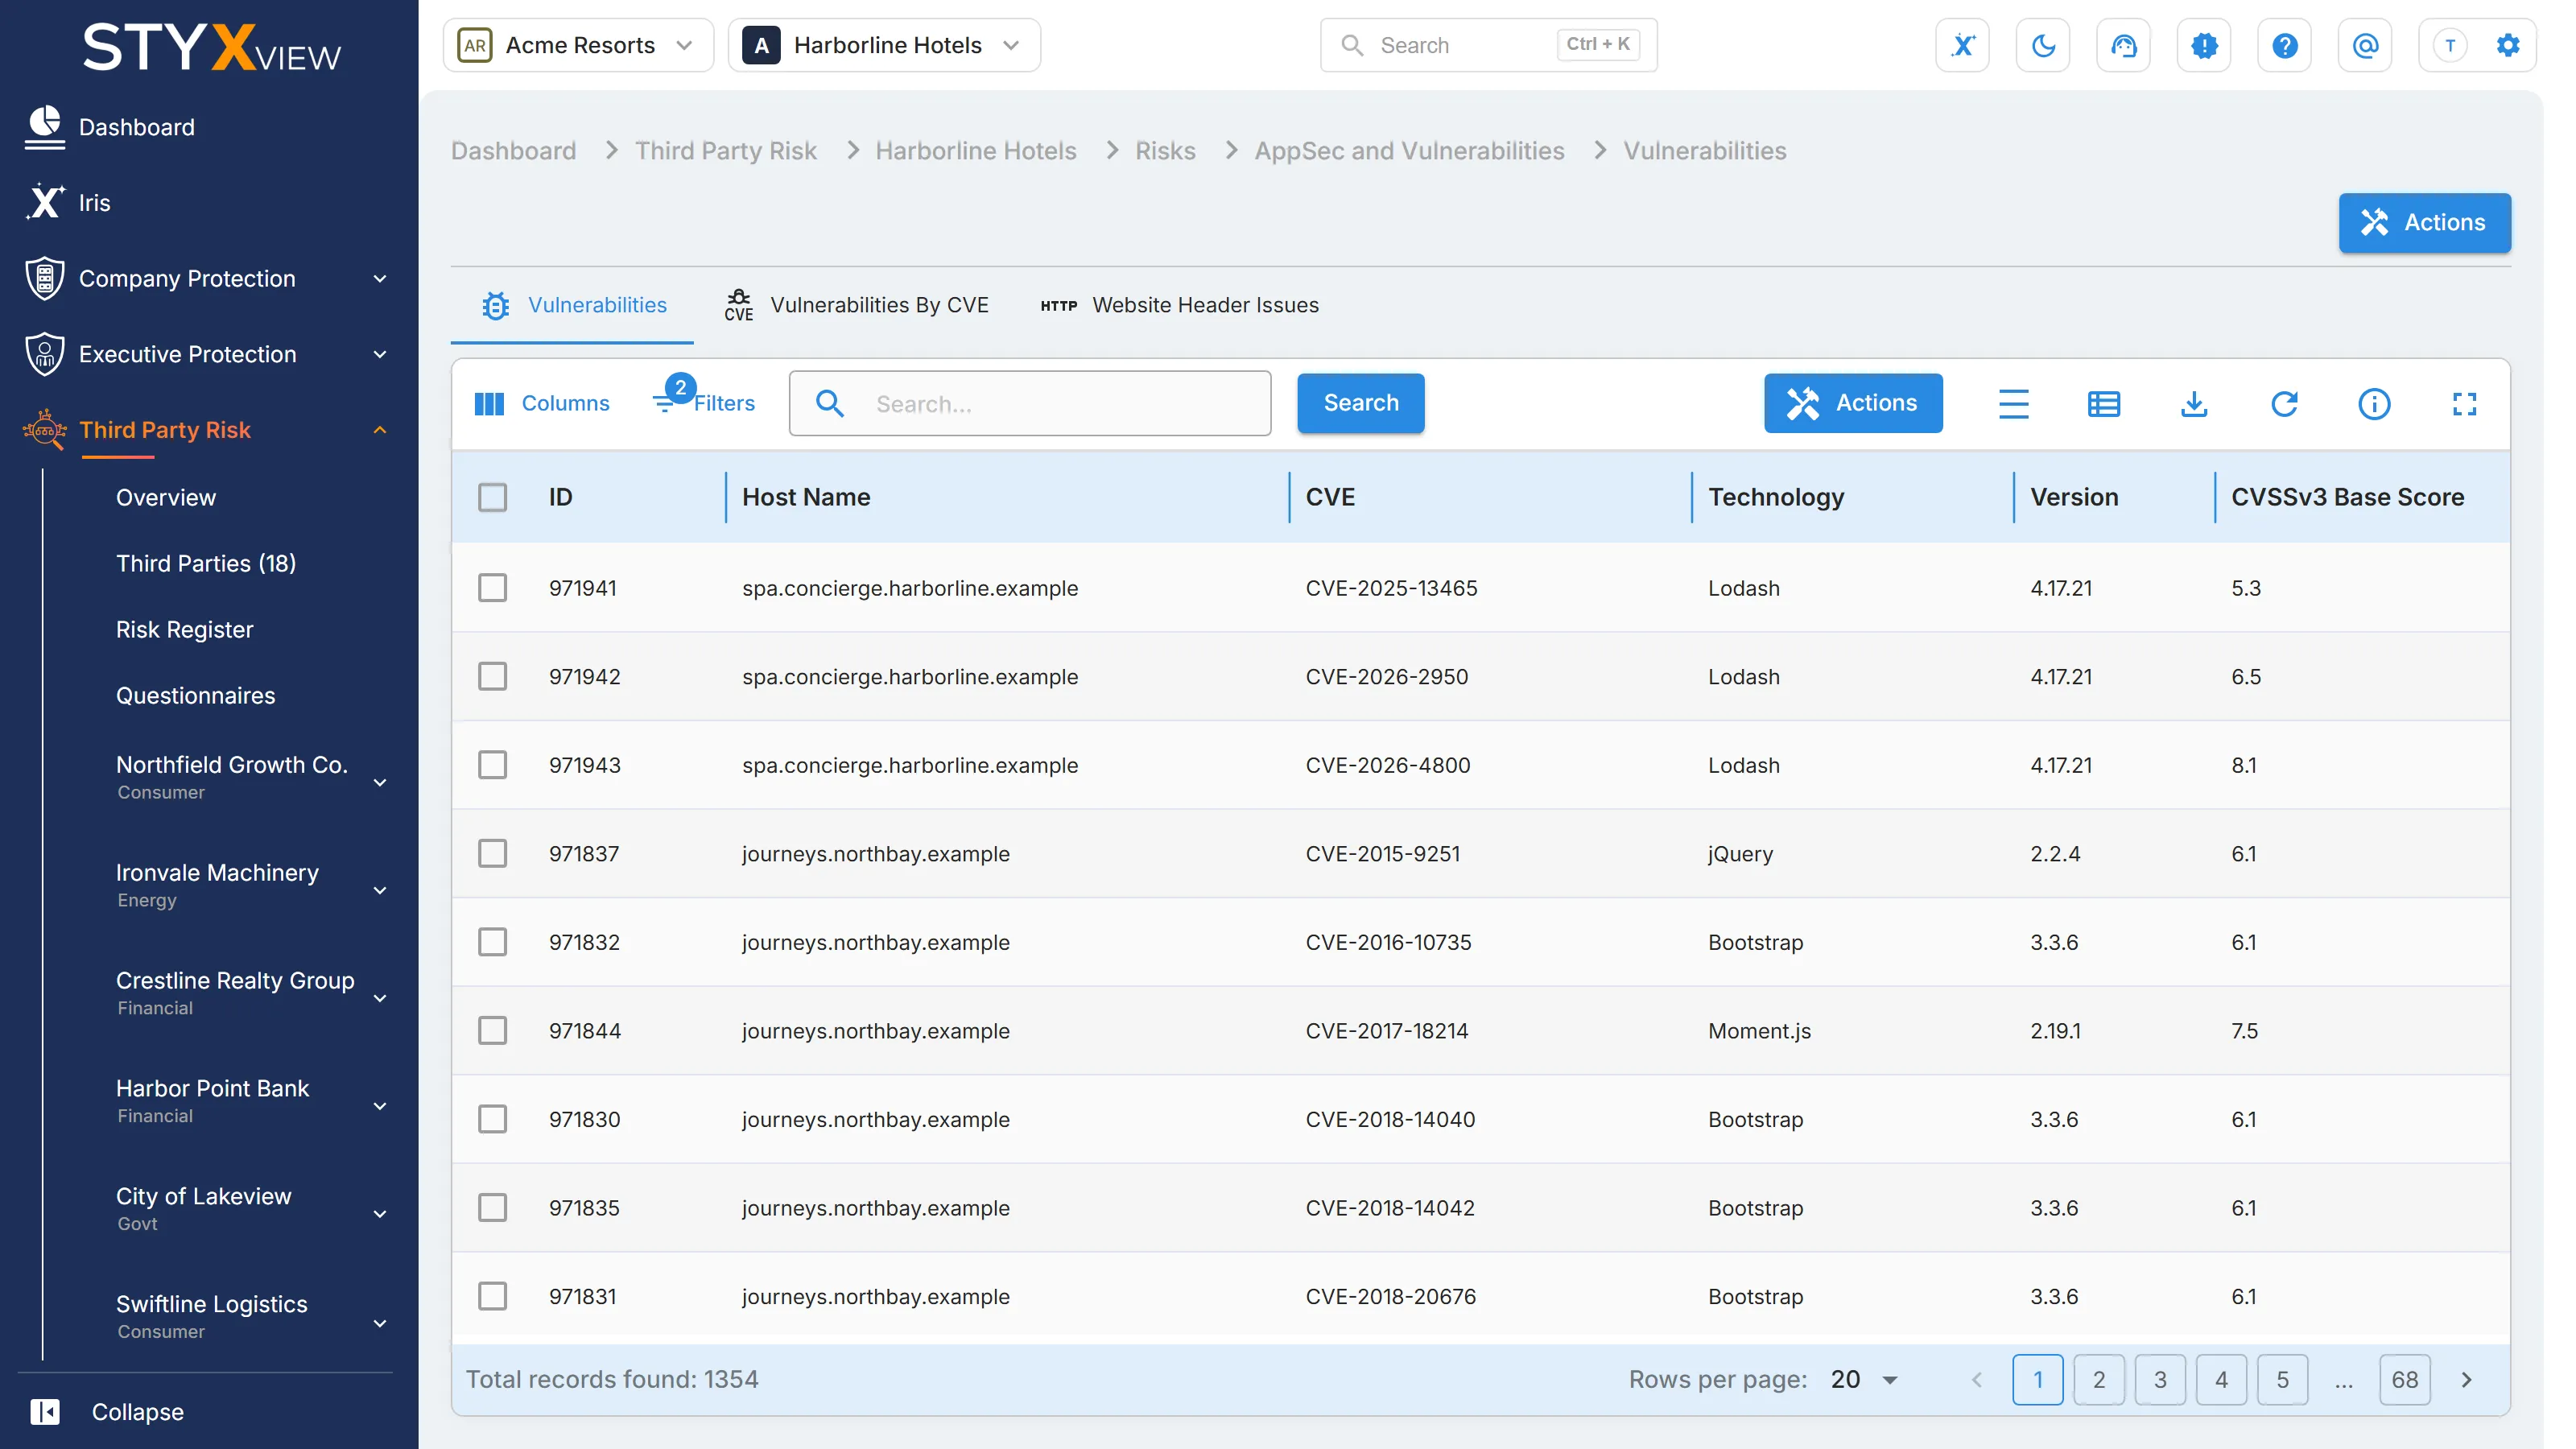
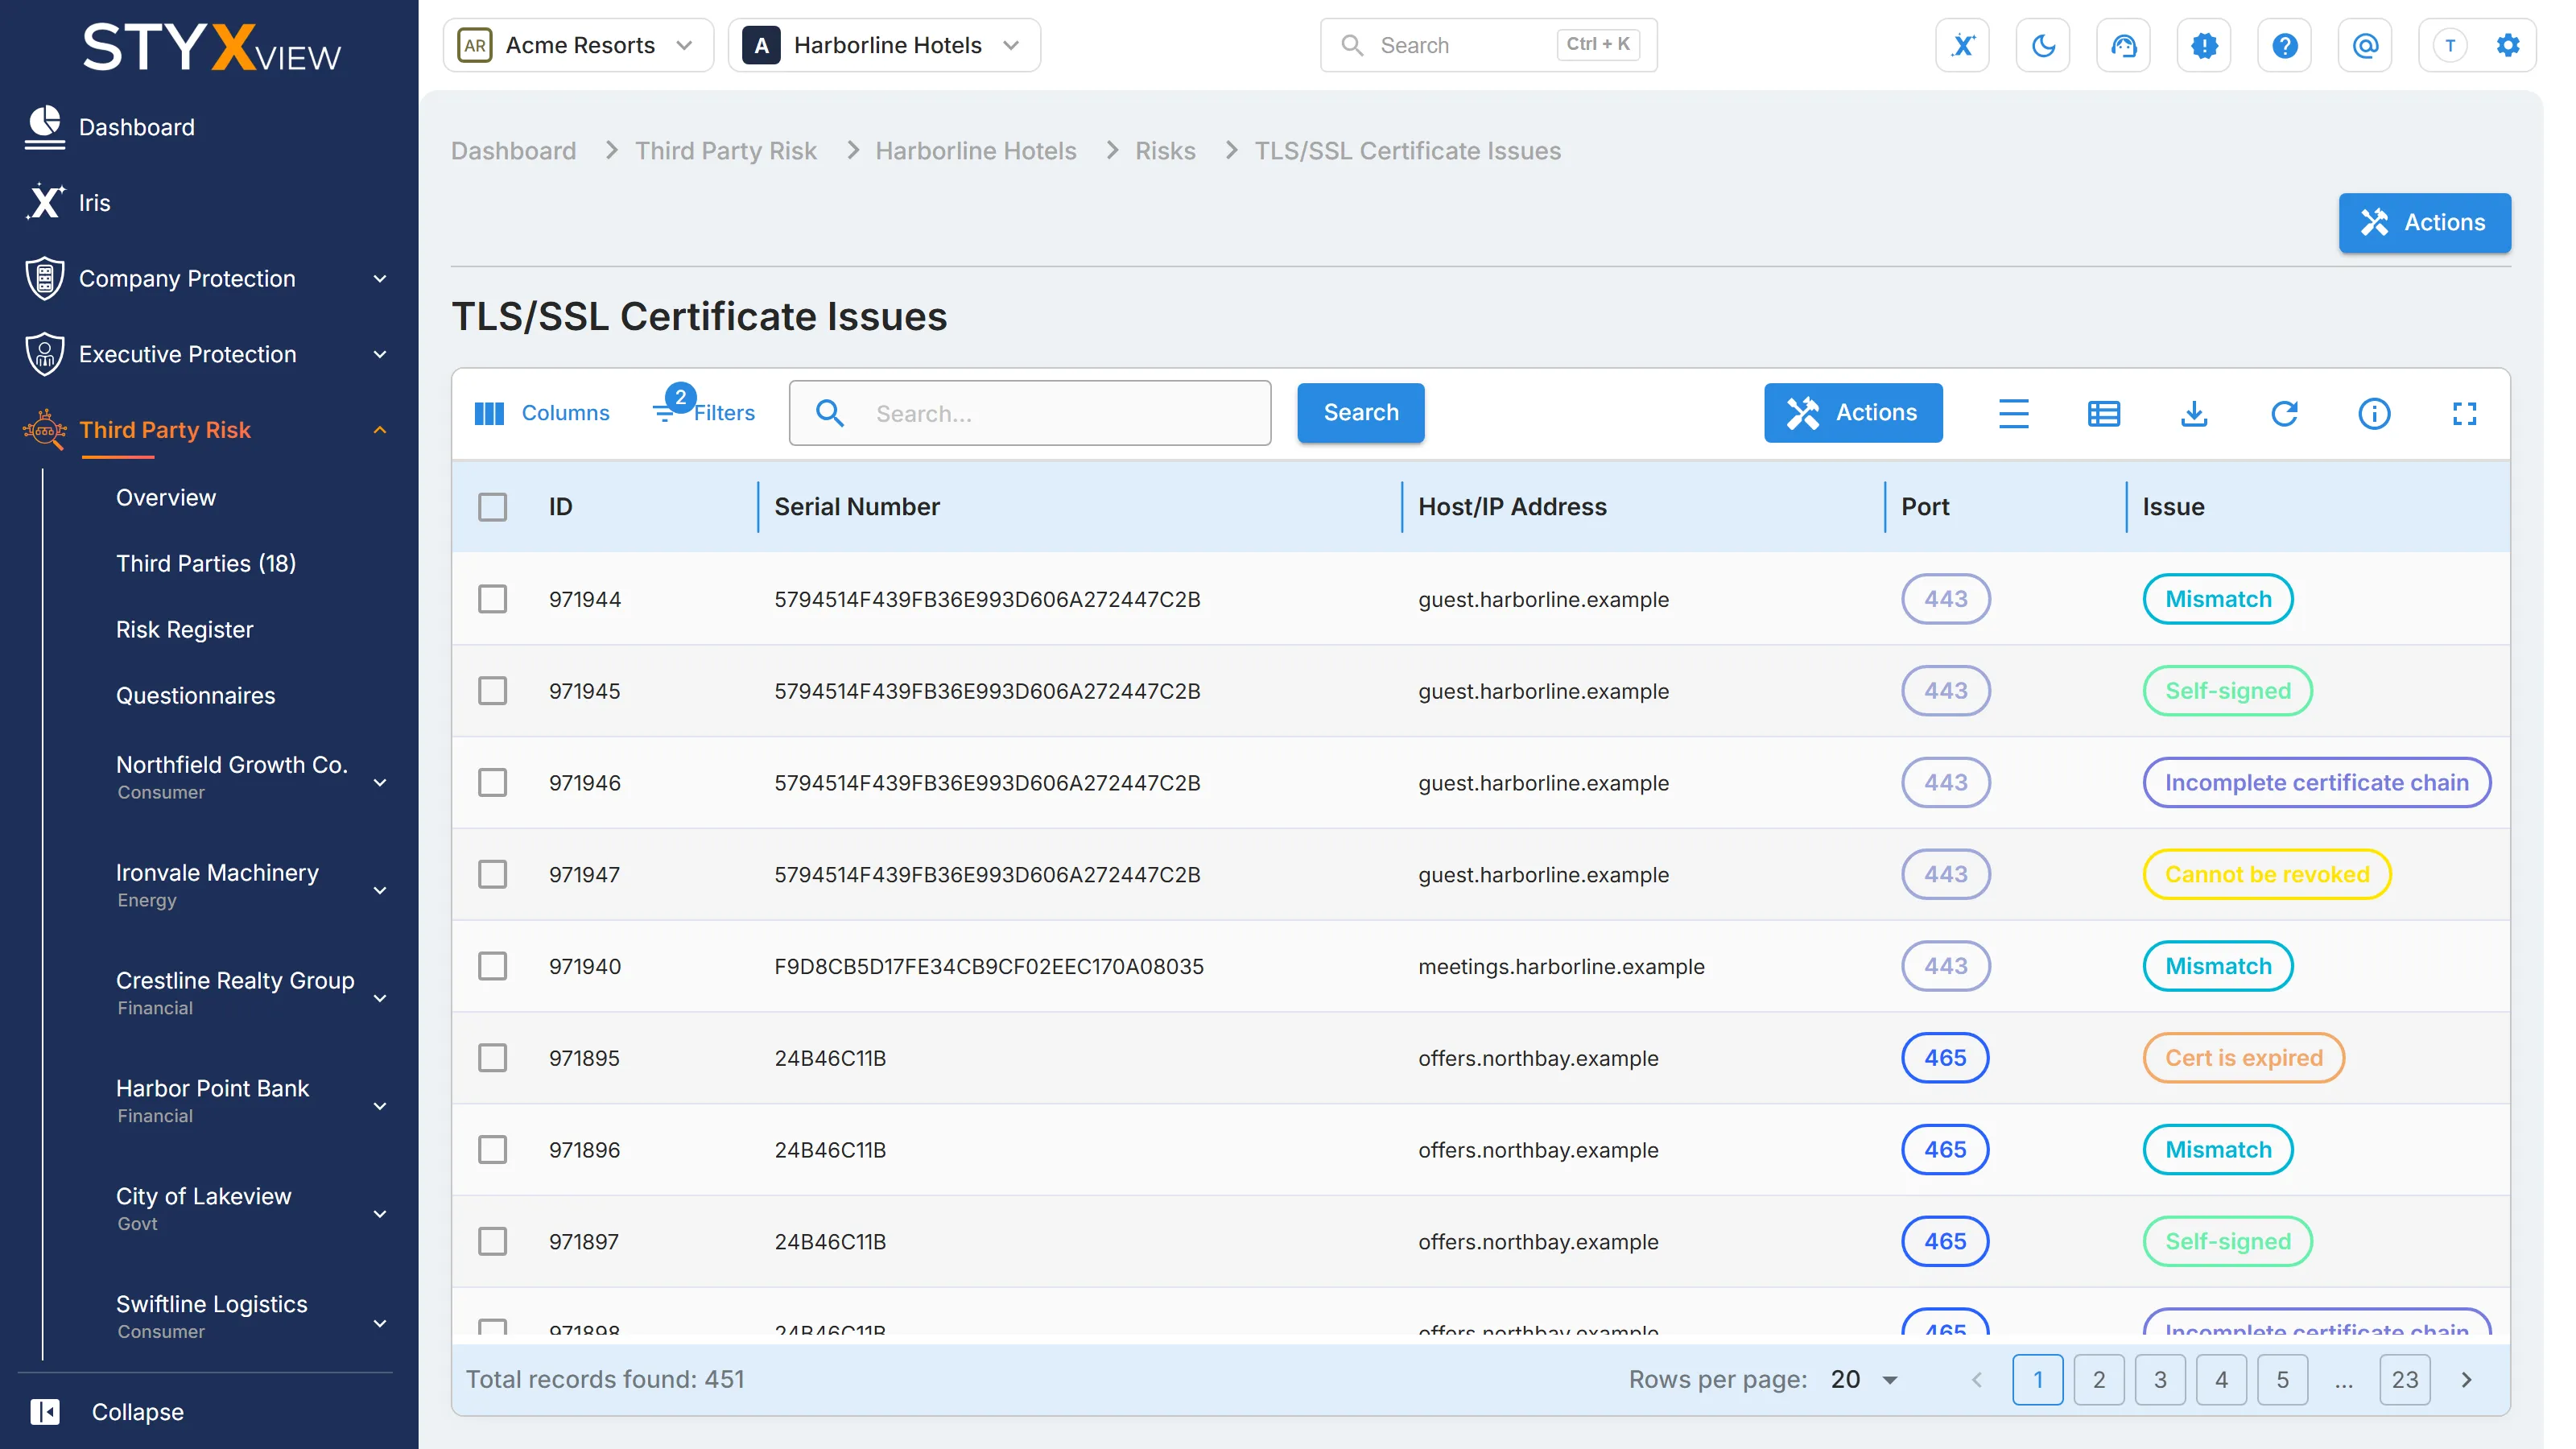
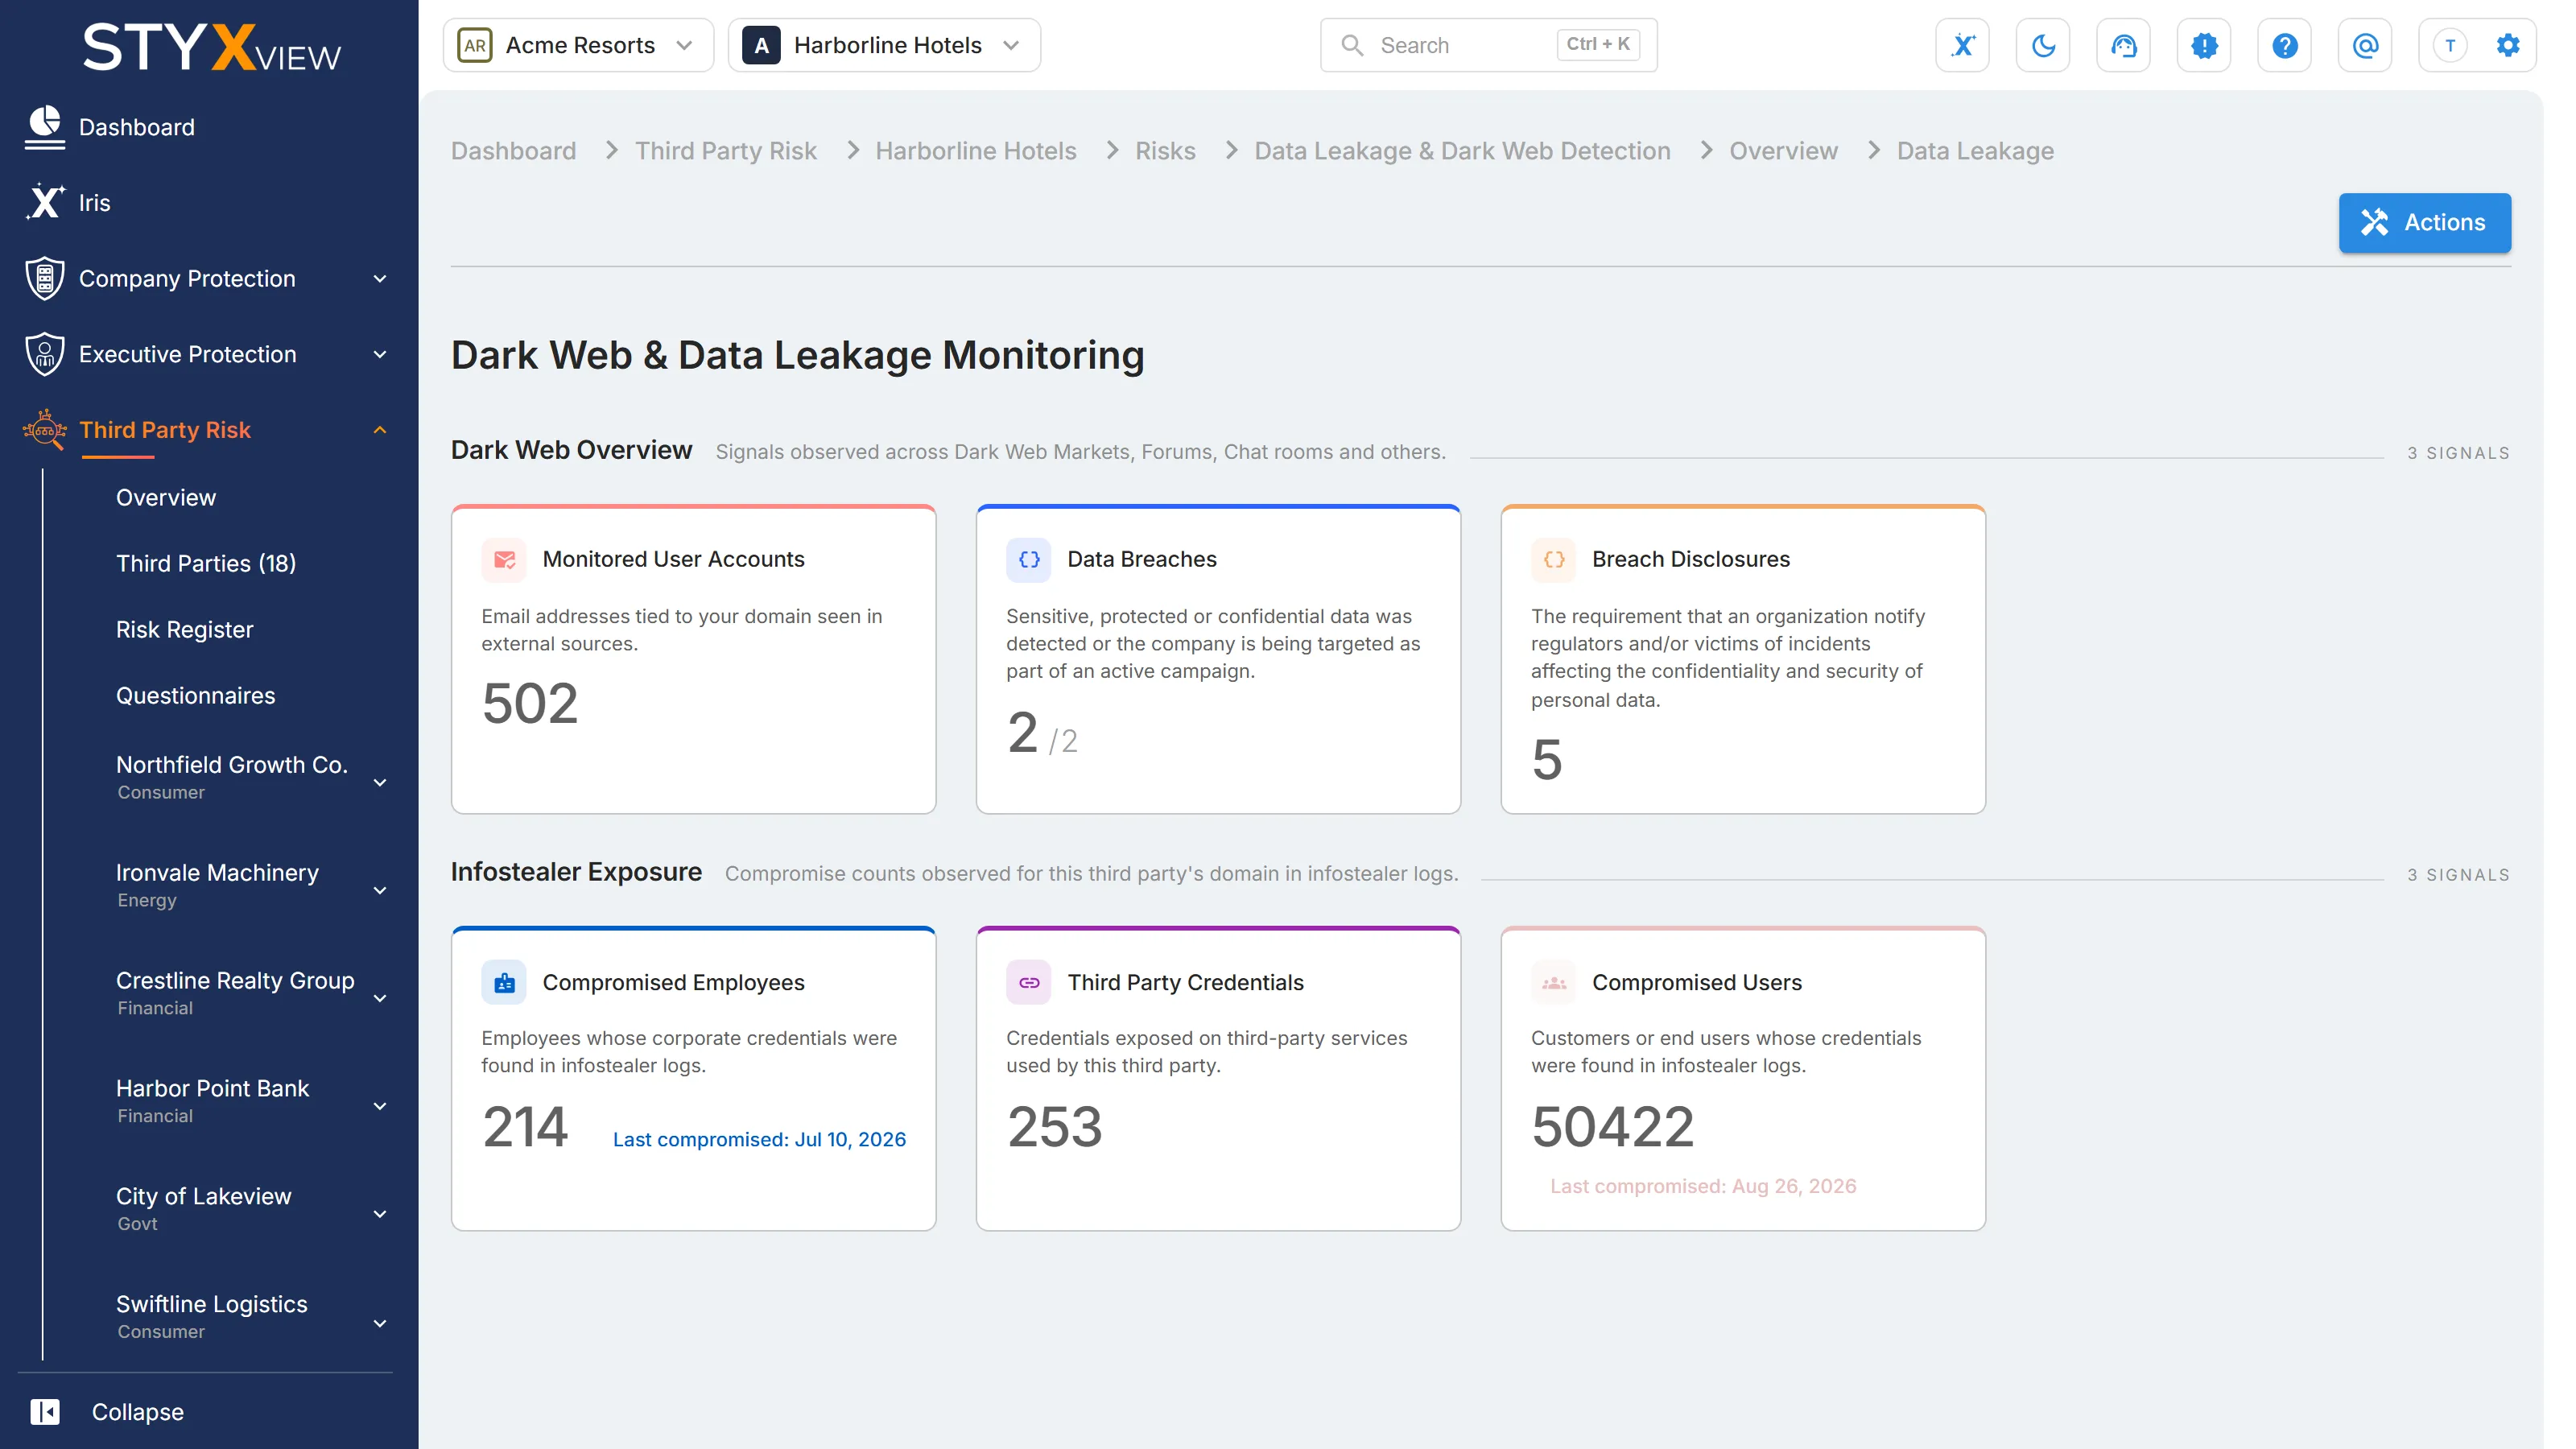
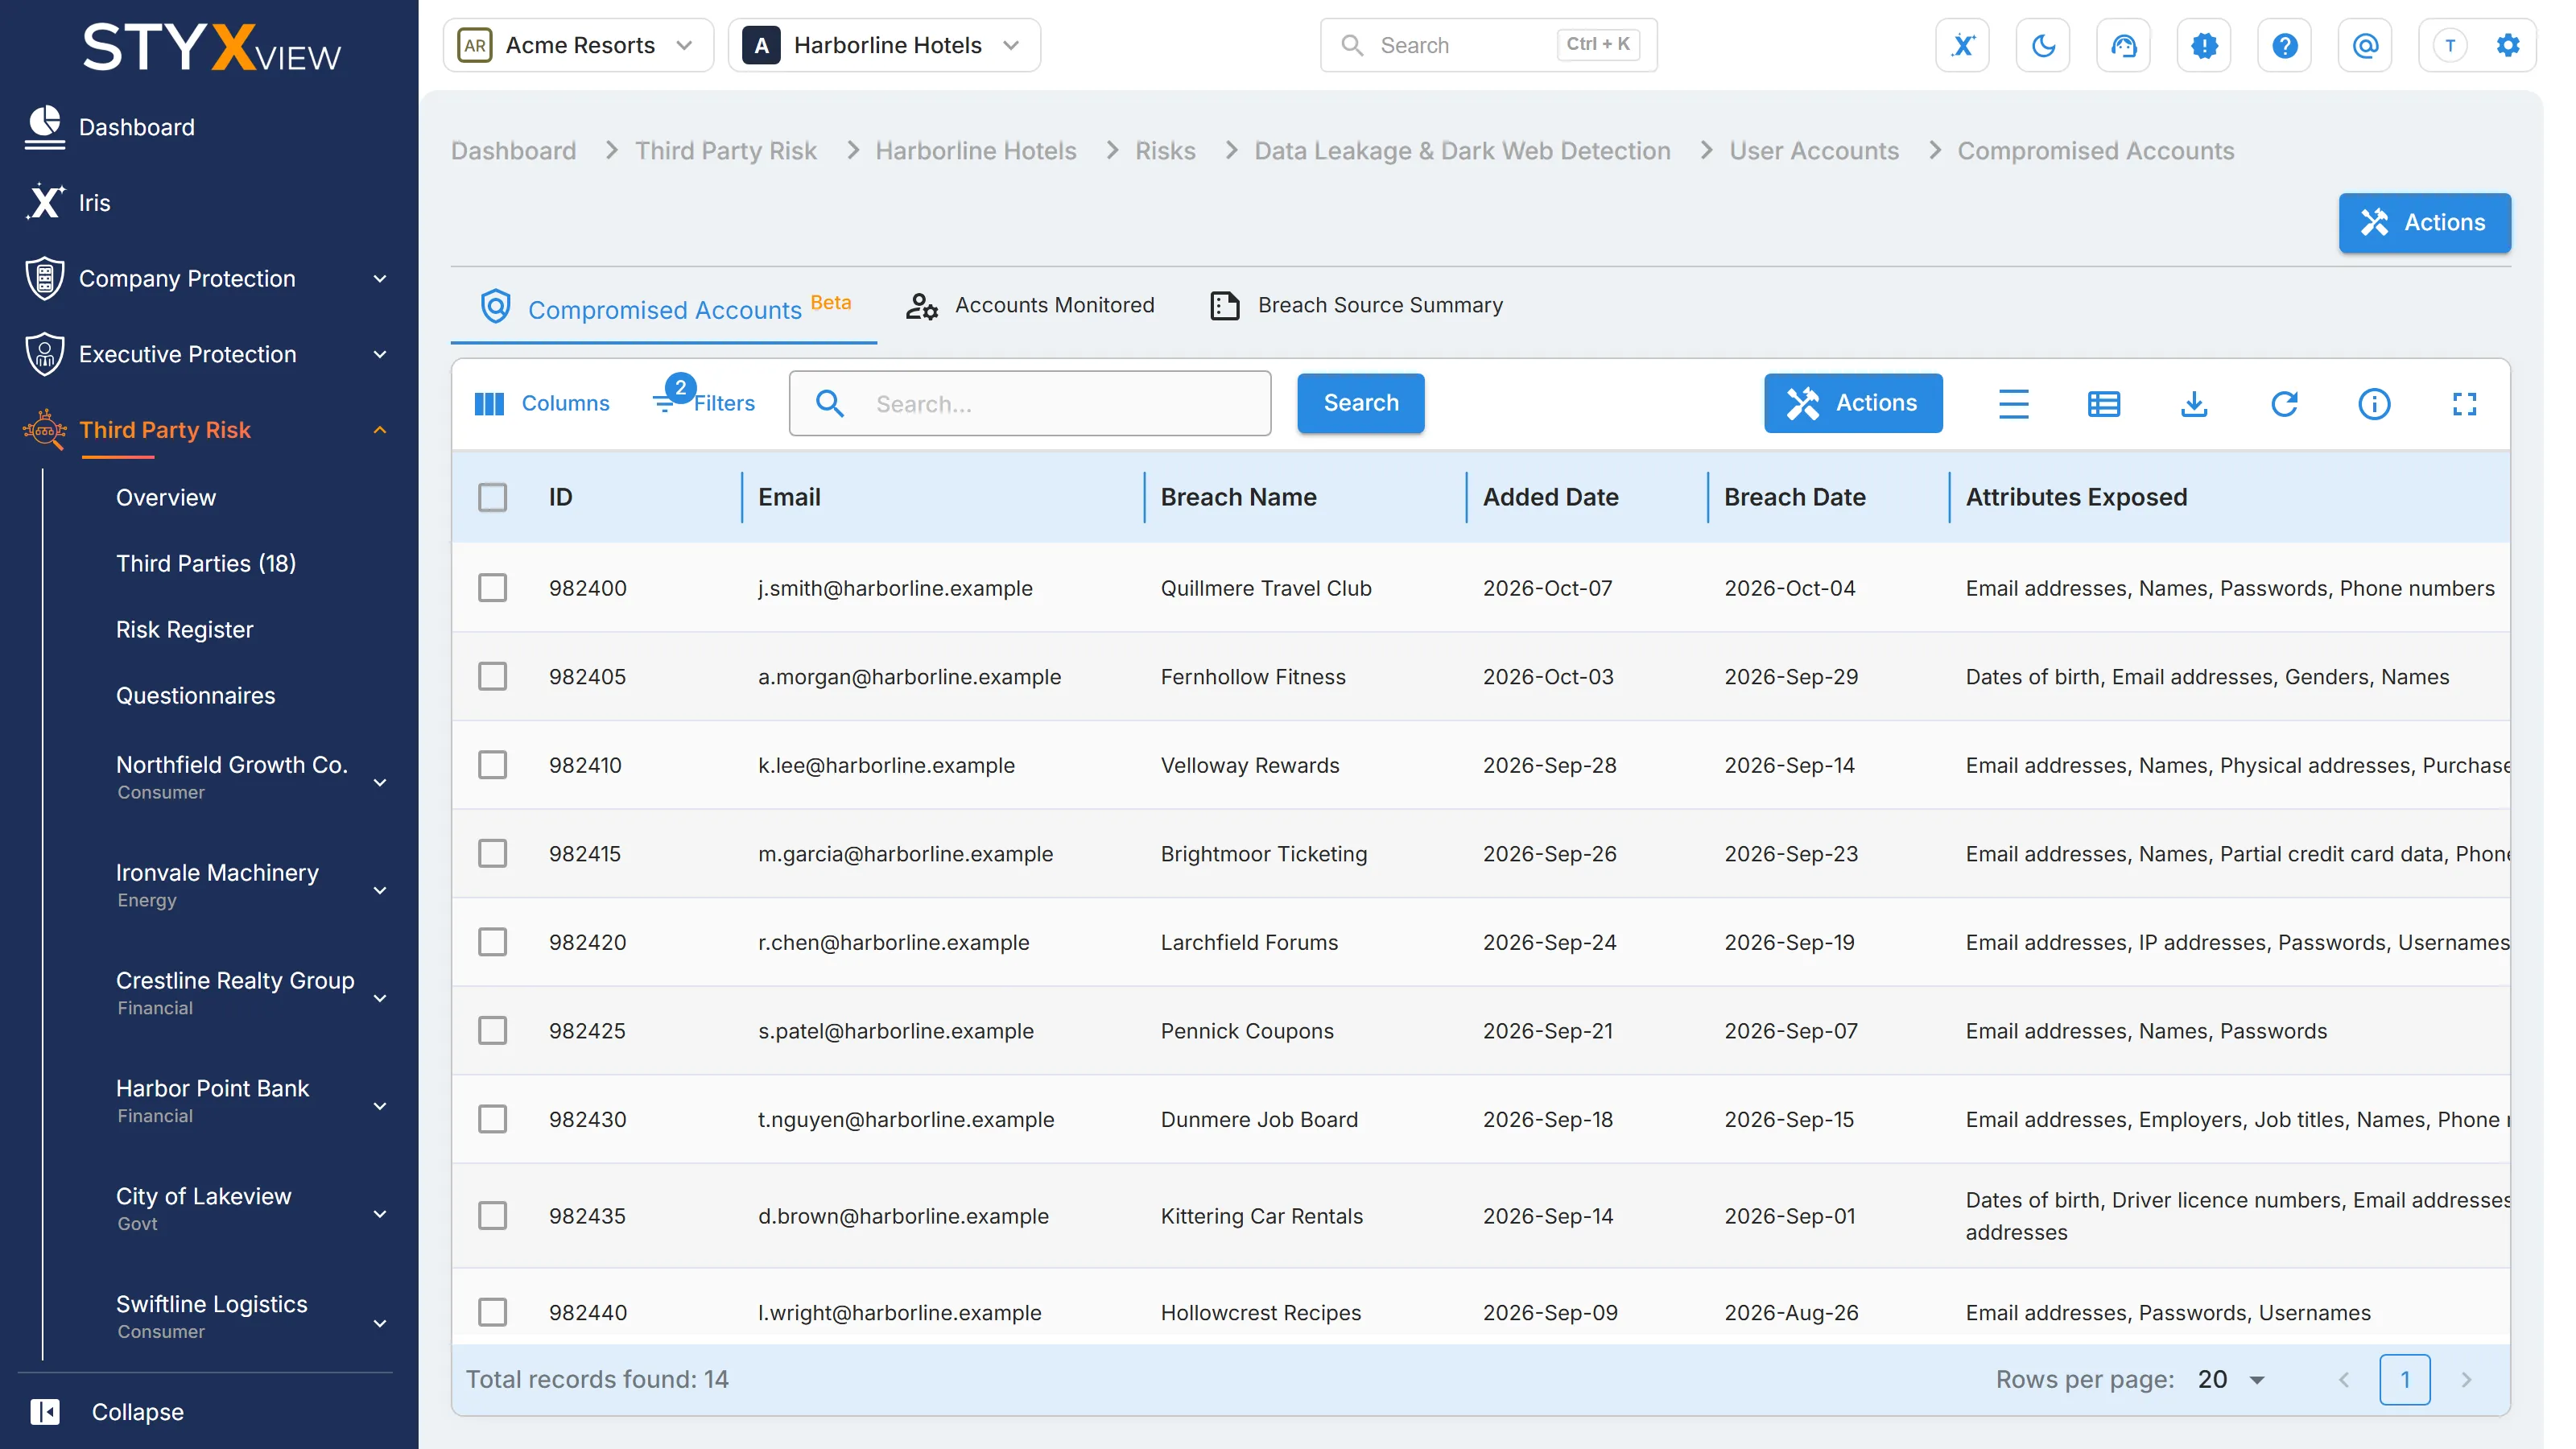
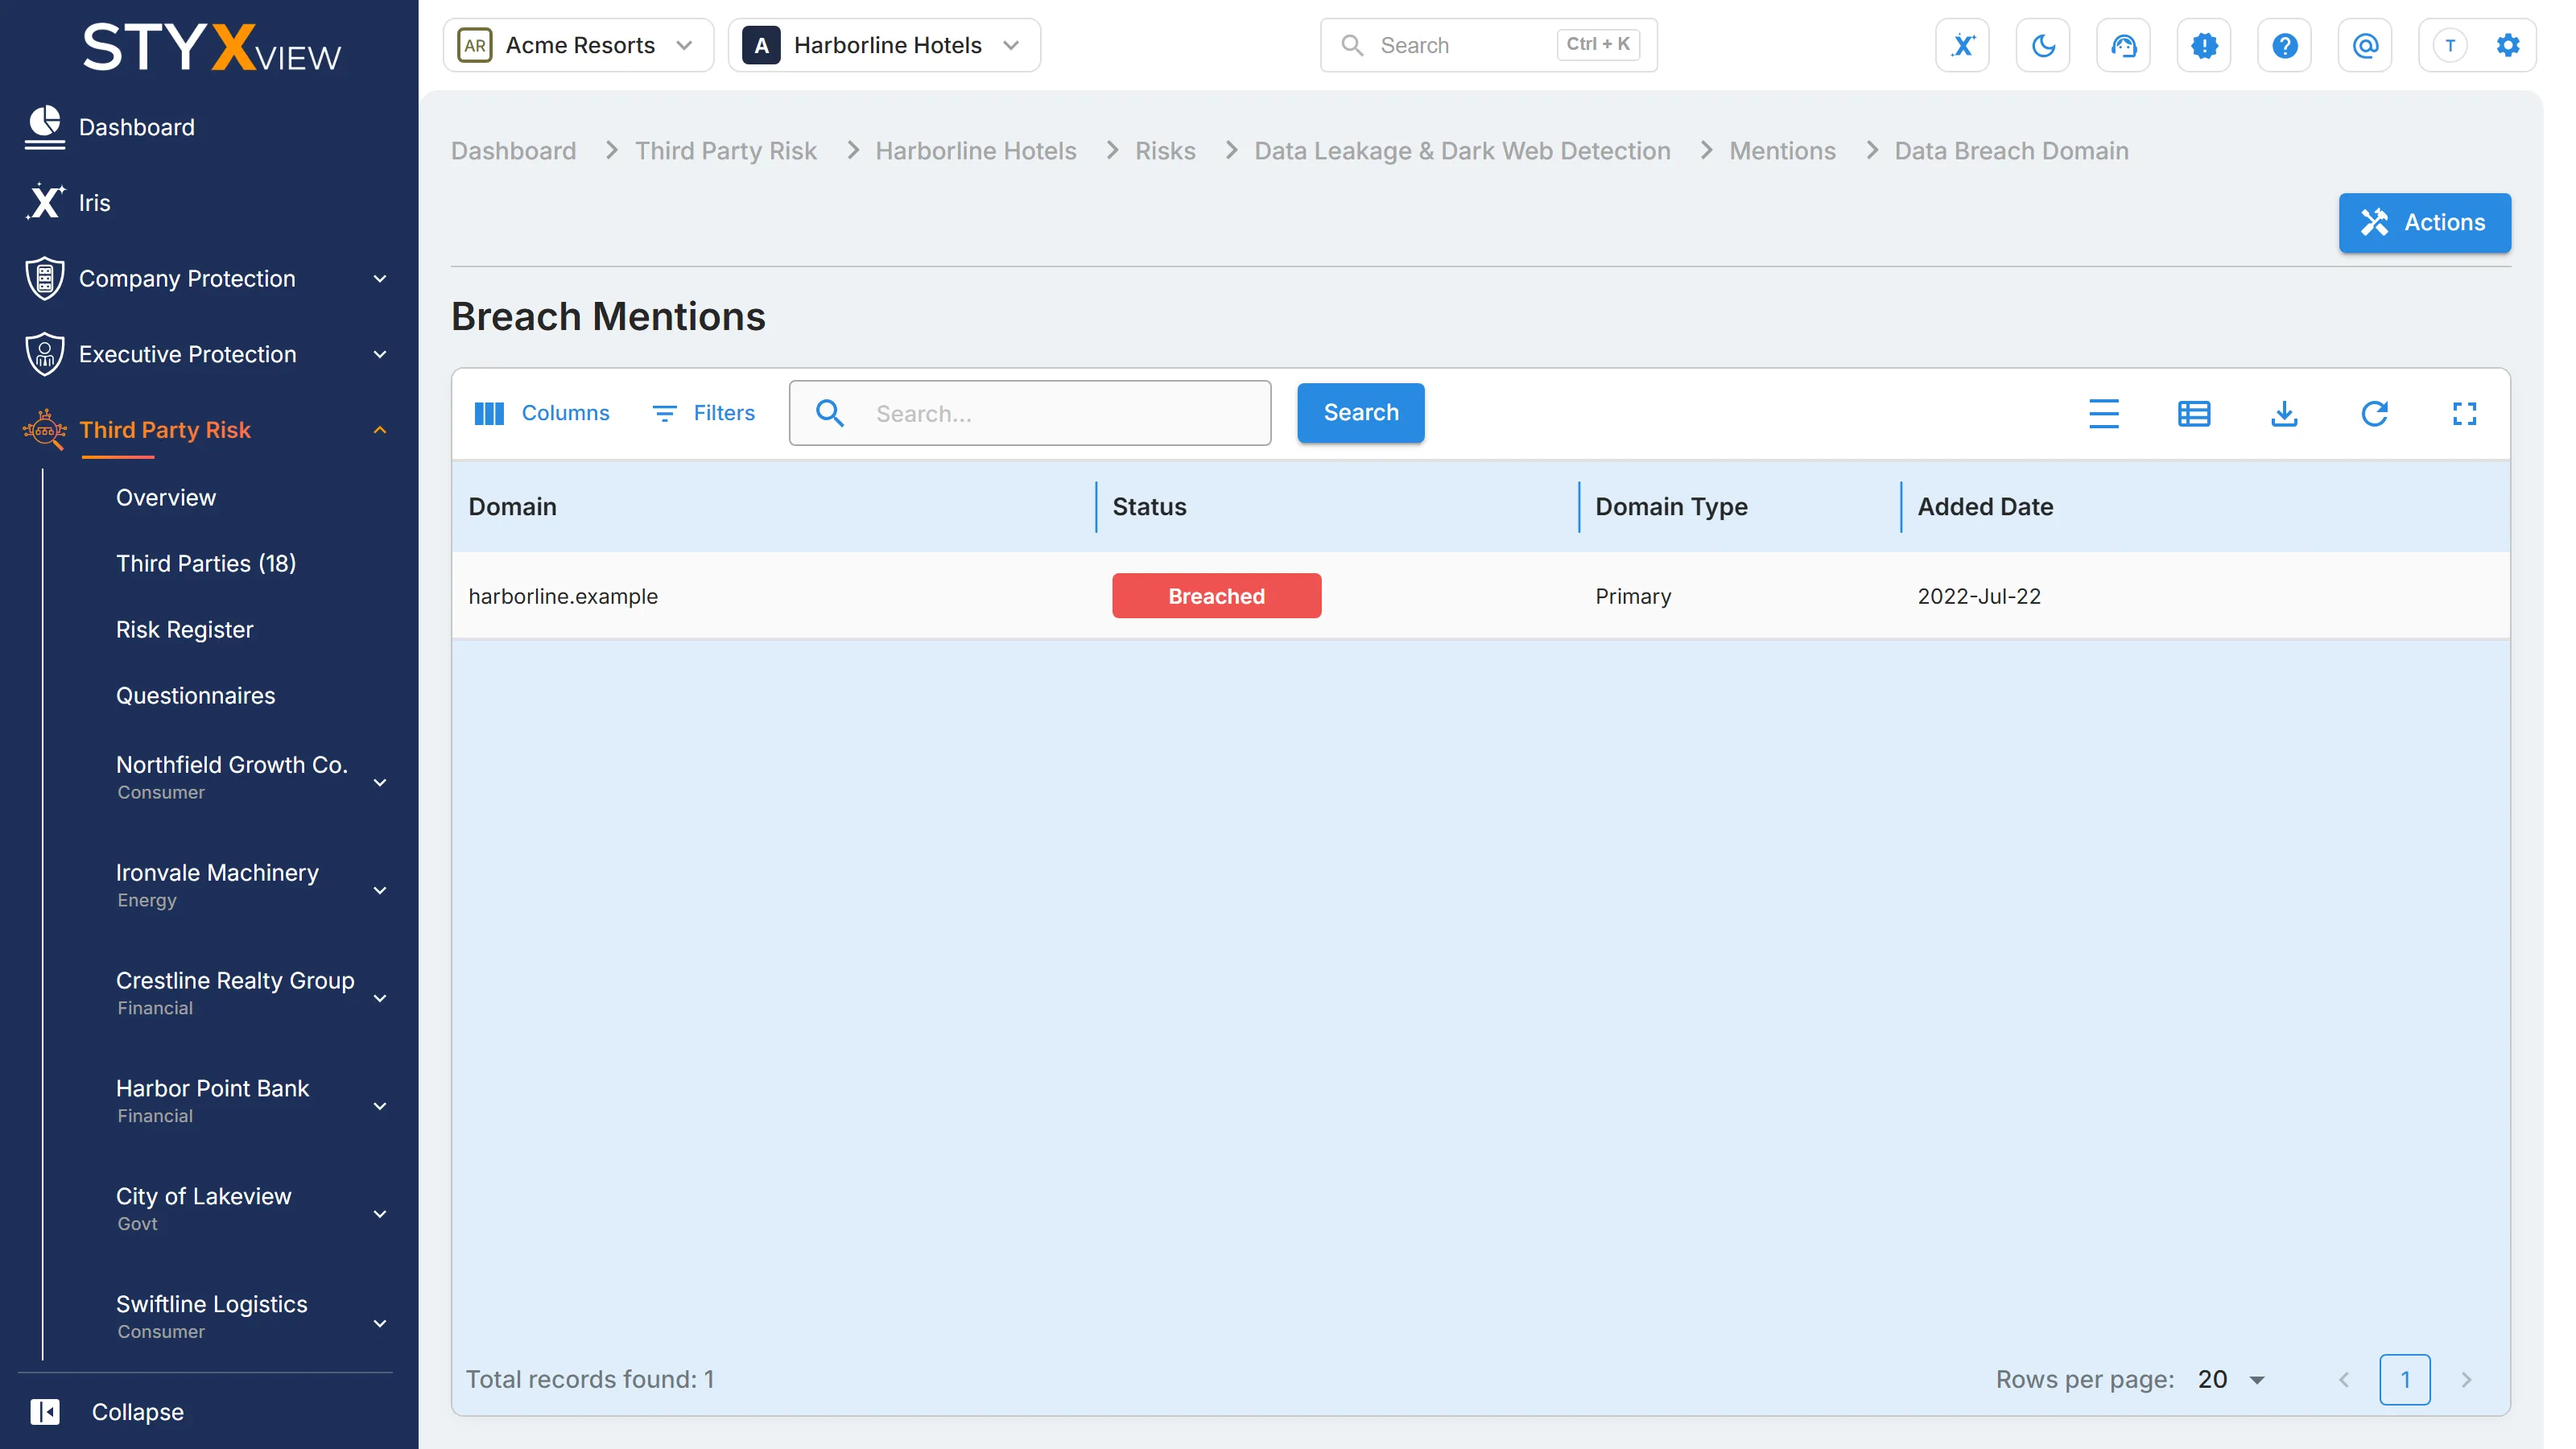
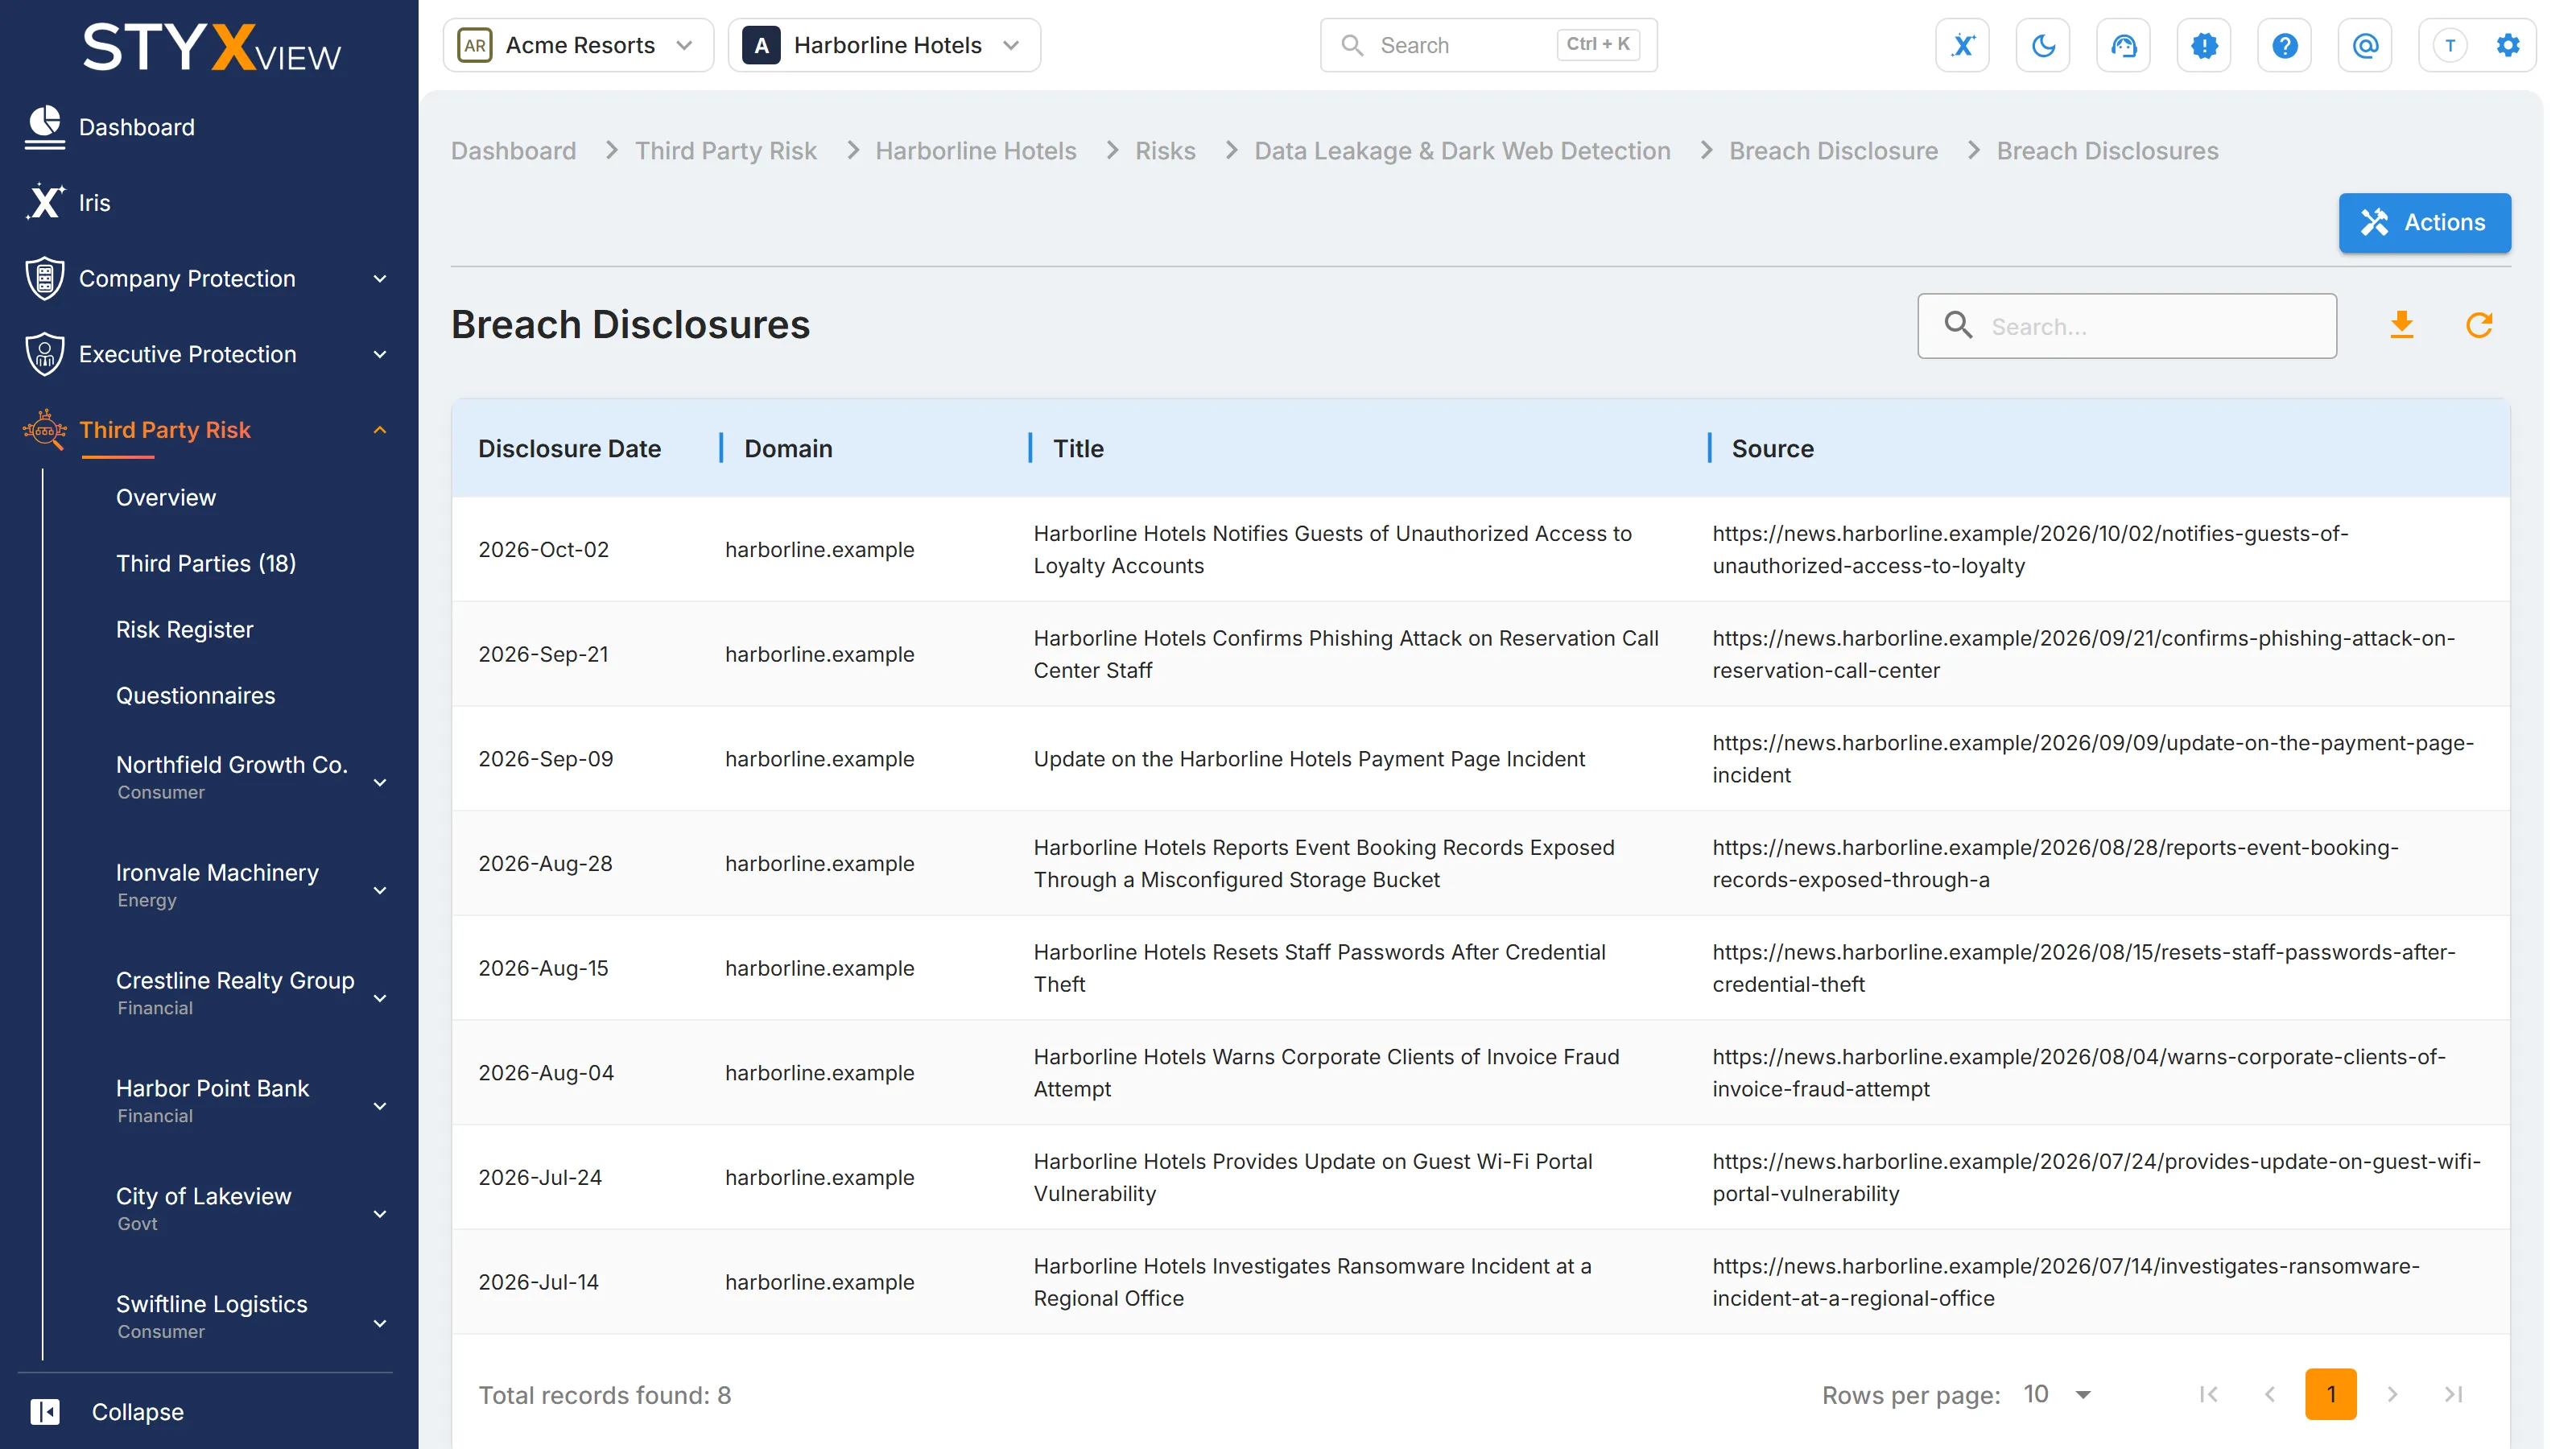
Under "Risks", the third party's detection pages are "Asset Reputation", "DNS Health Issues", "Network Security", "AppSec and Vulnerabilities", "TLS/SSL Certificate Issues", "Data Leakage & Dark Web Detection" (with "User Accounts", "Mentions", and "Breach Disclosure"), and "Lookalike Domains". Each lists the third party's findings the way the Company Protection page of the same name lists yours.
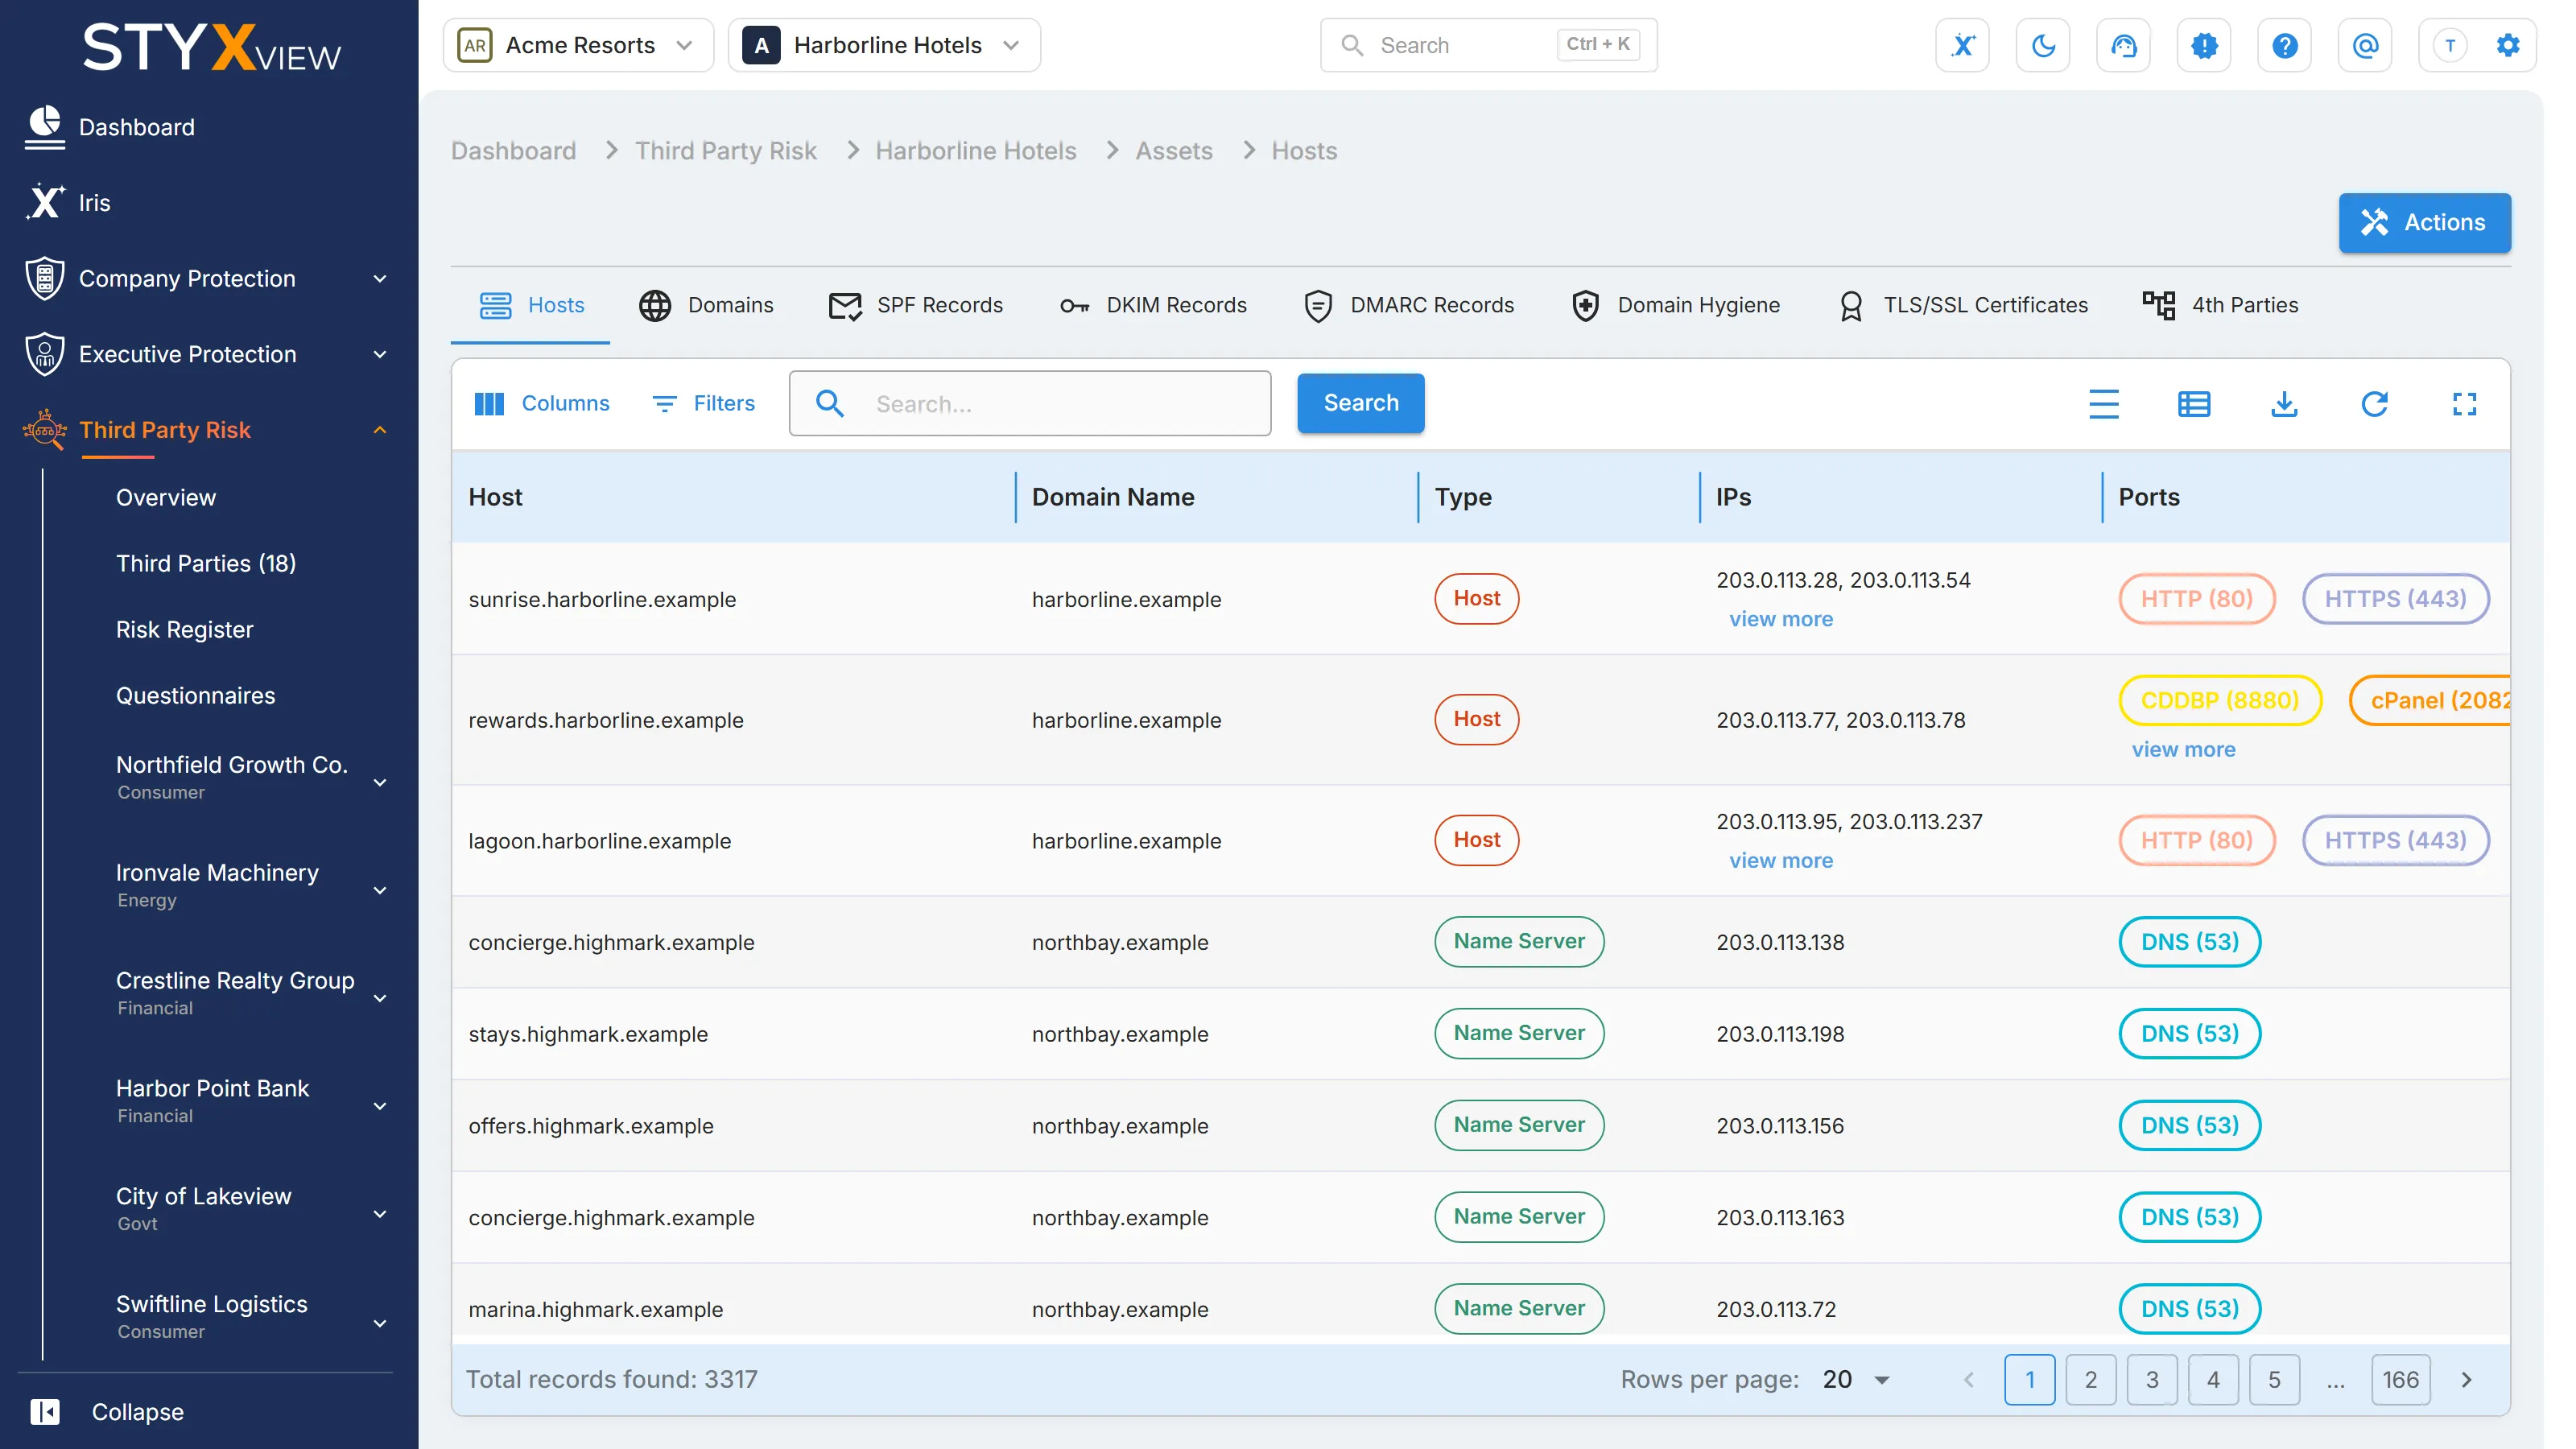
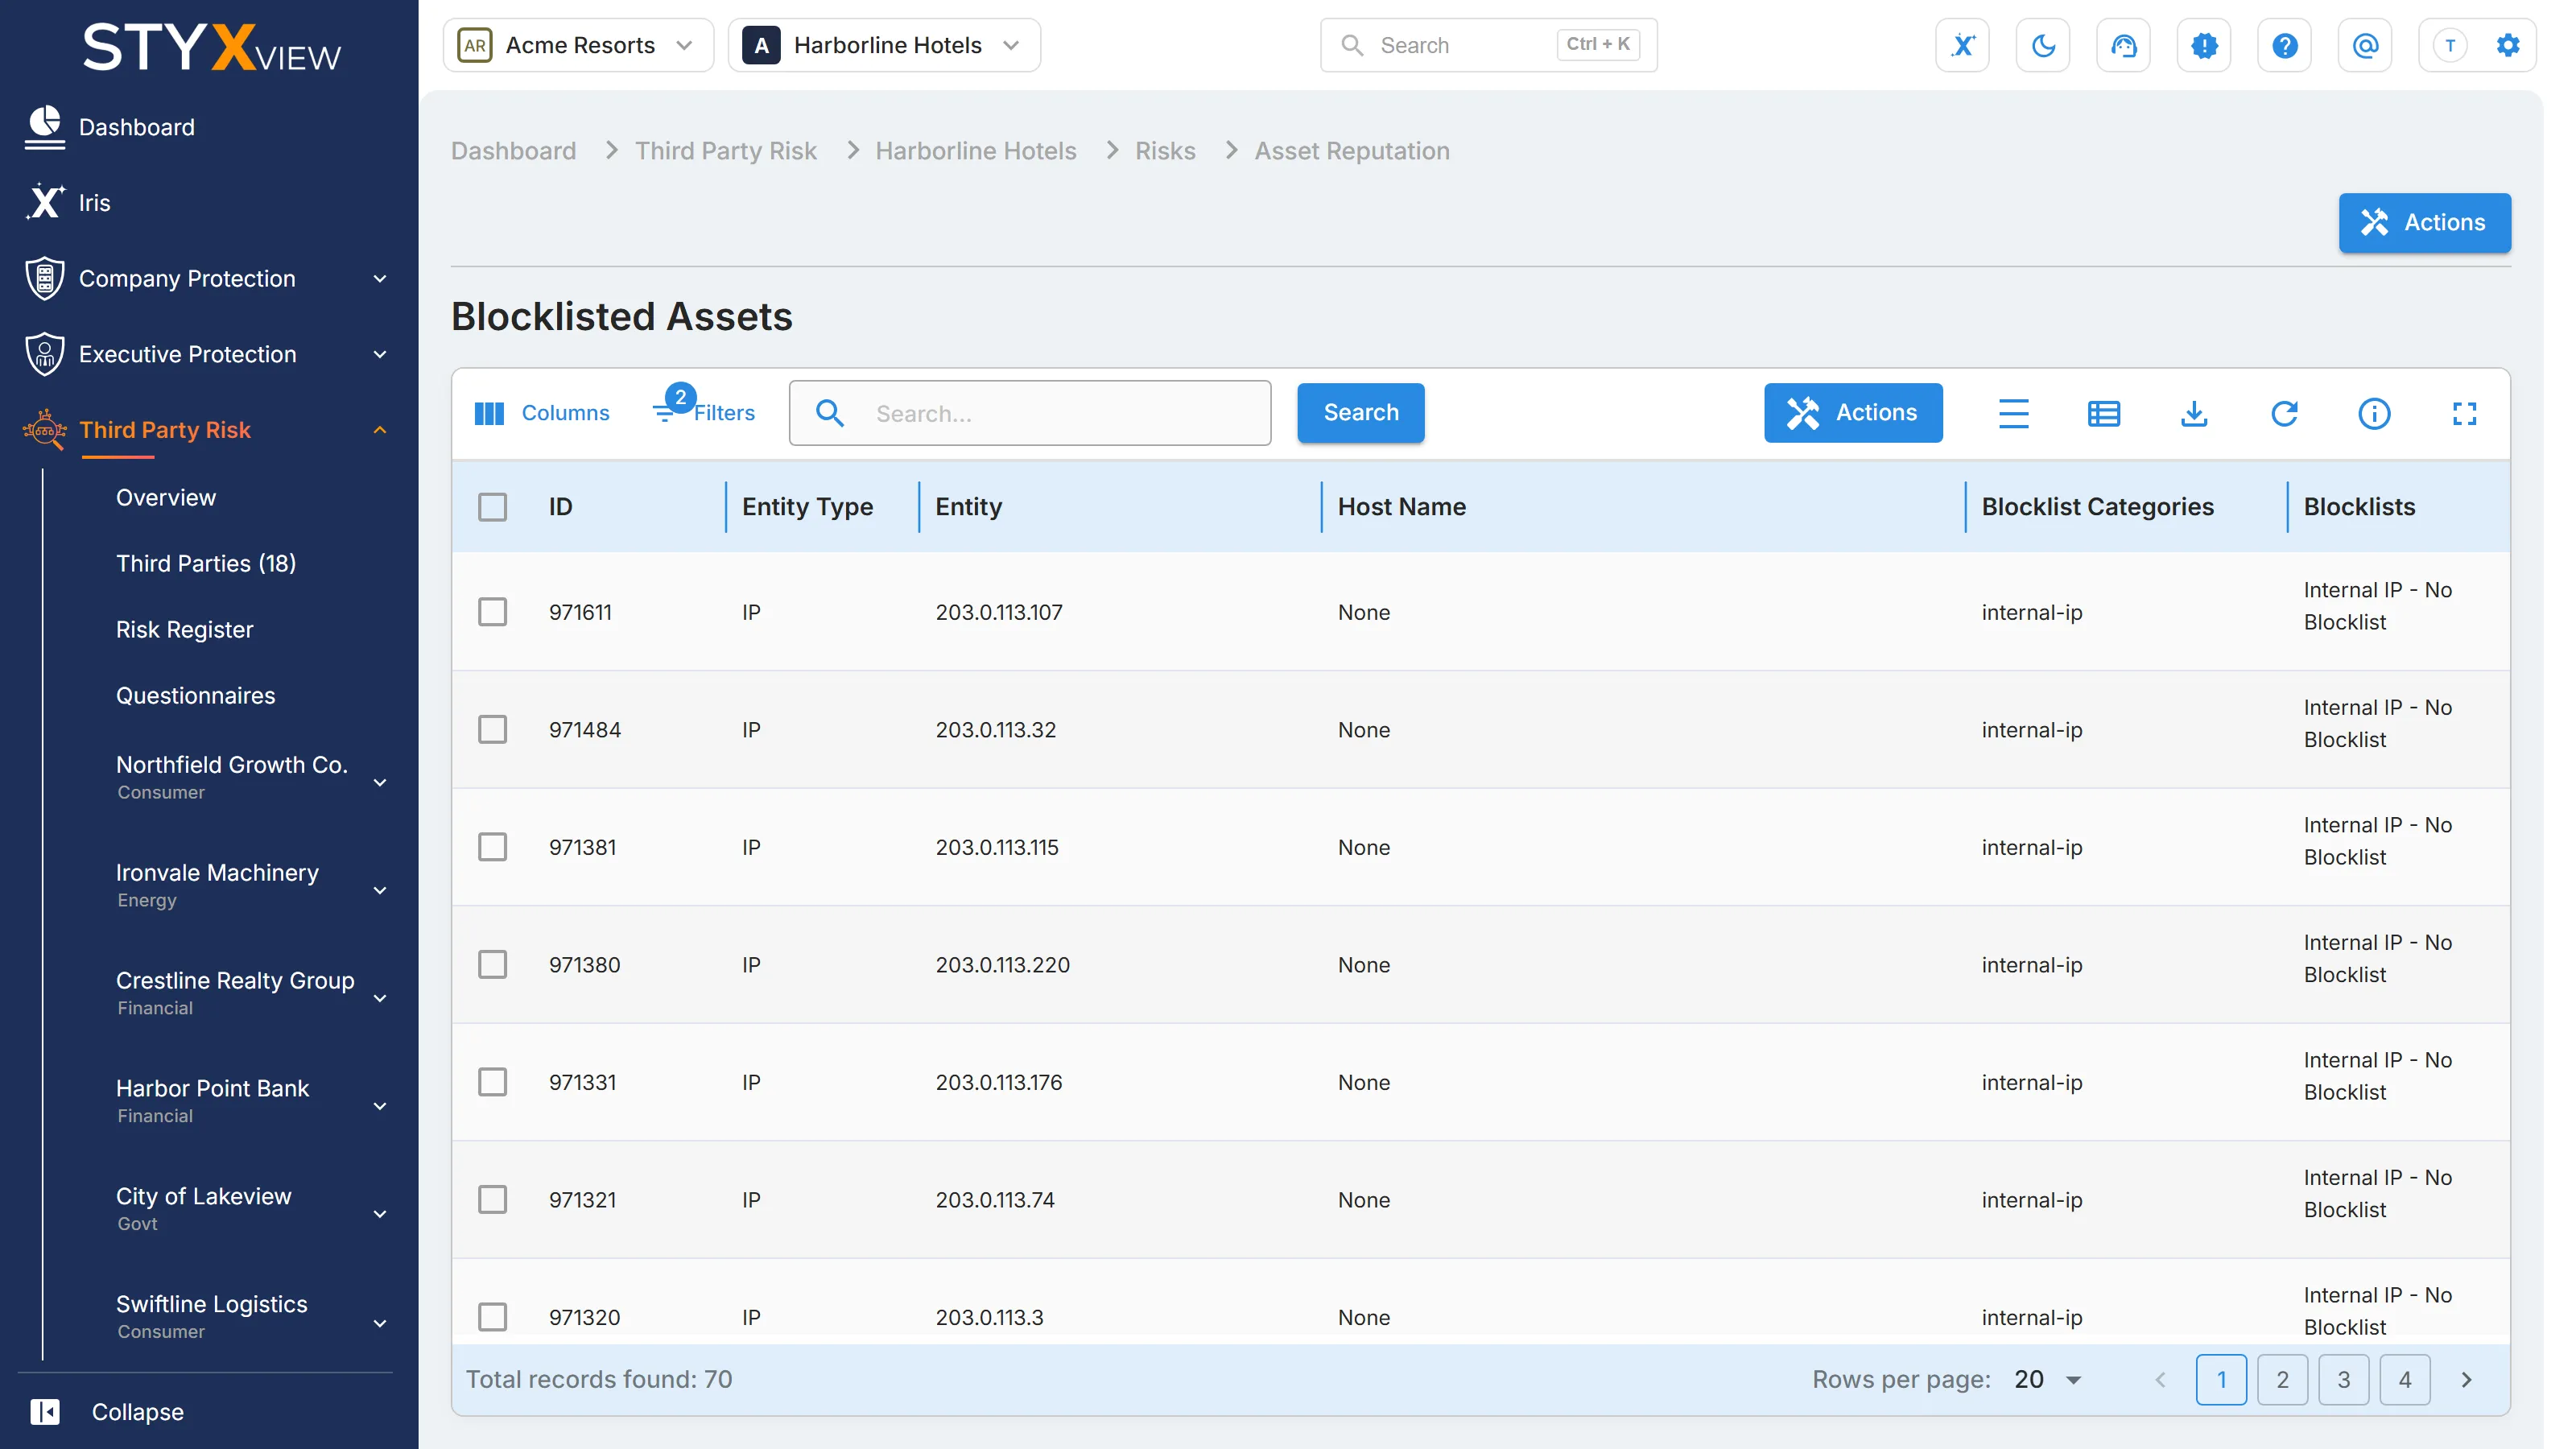
Individual third party risk interface and views
Section titled “Individual third party risk interface and views”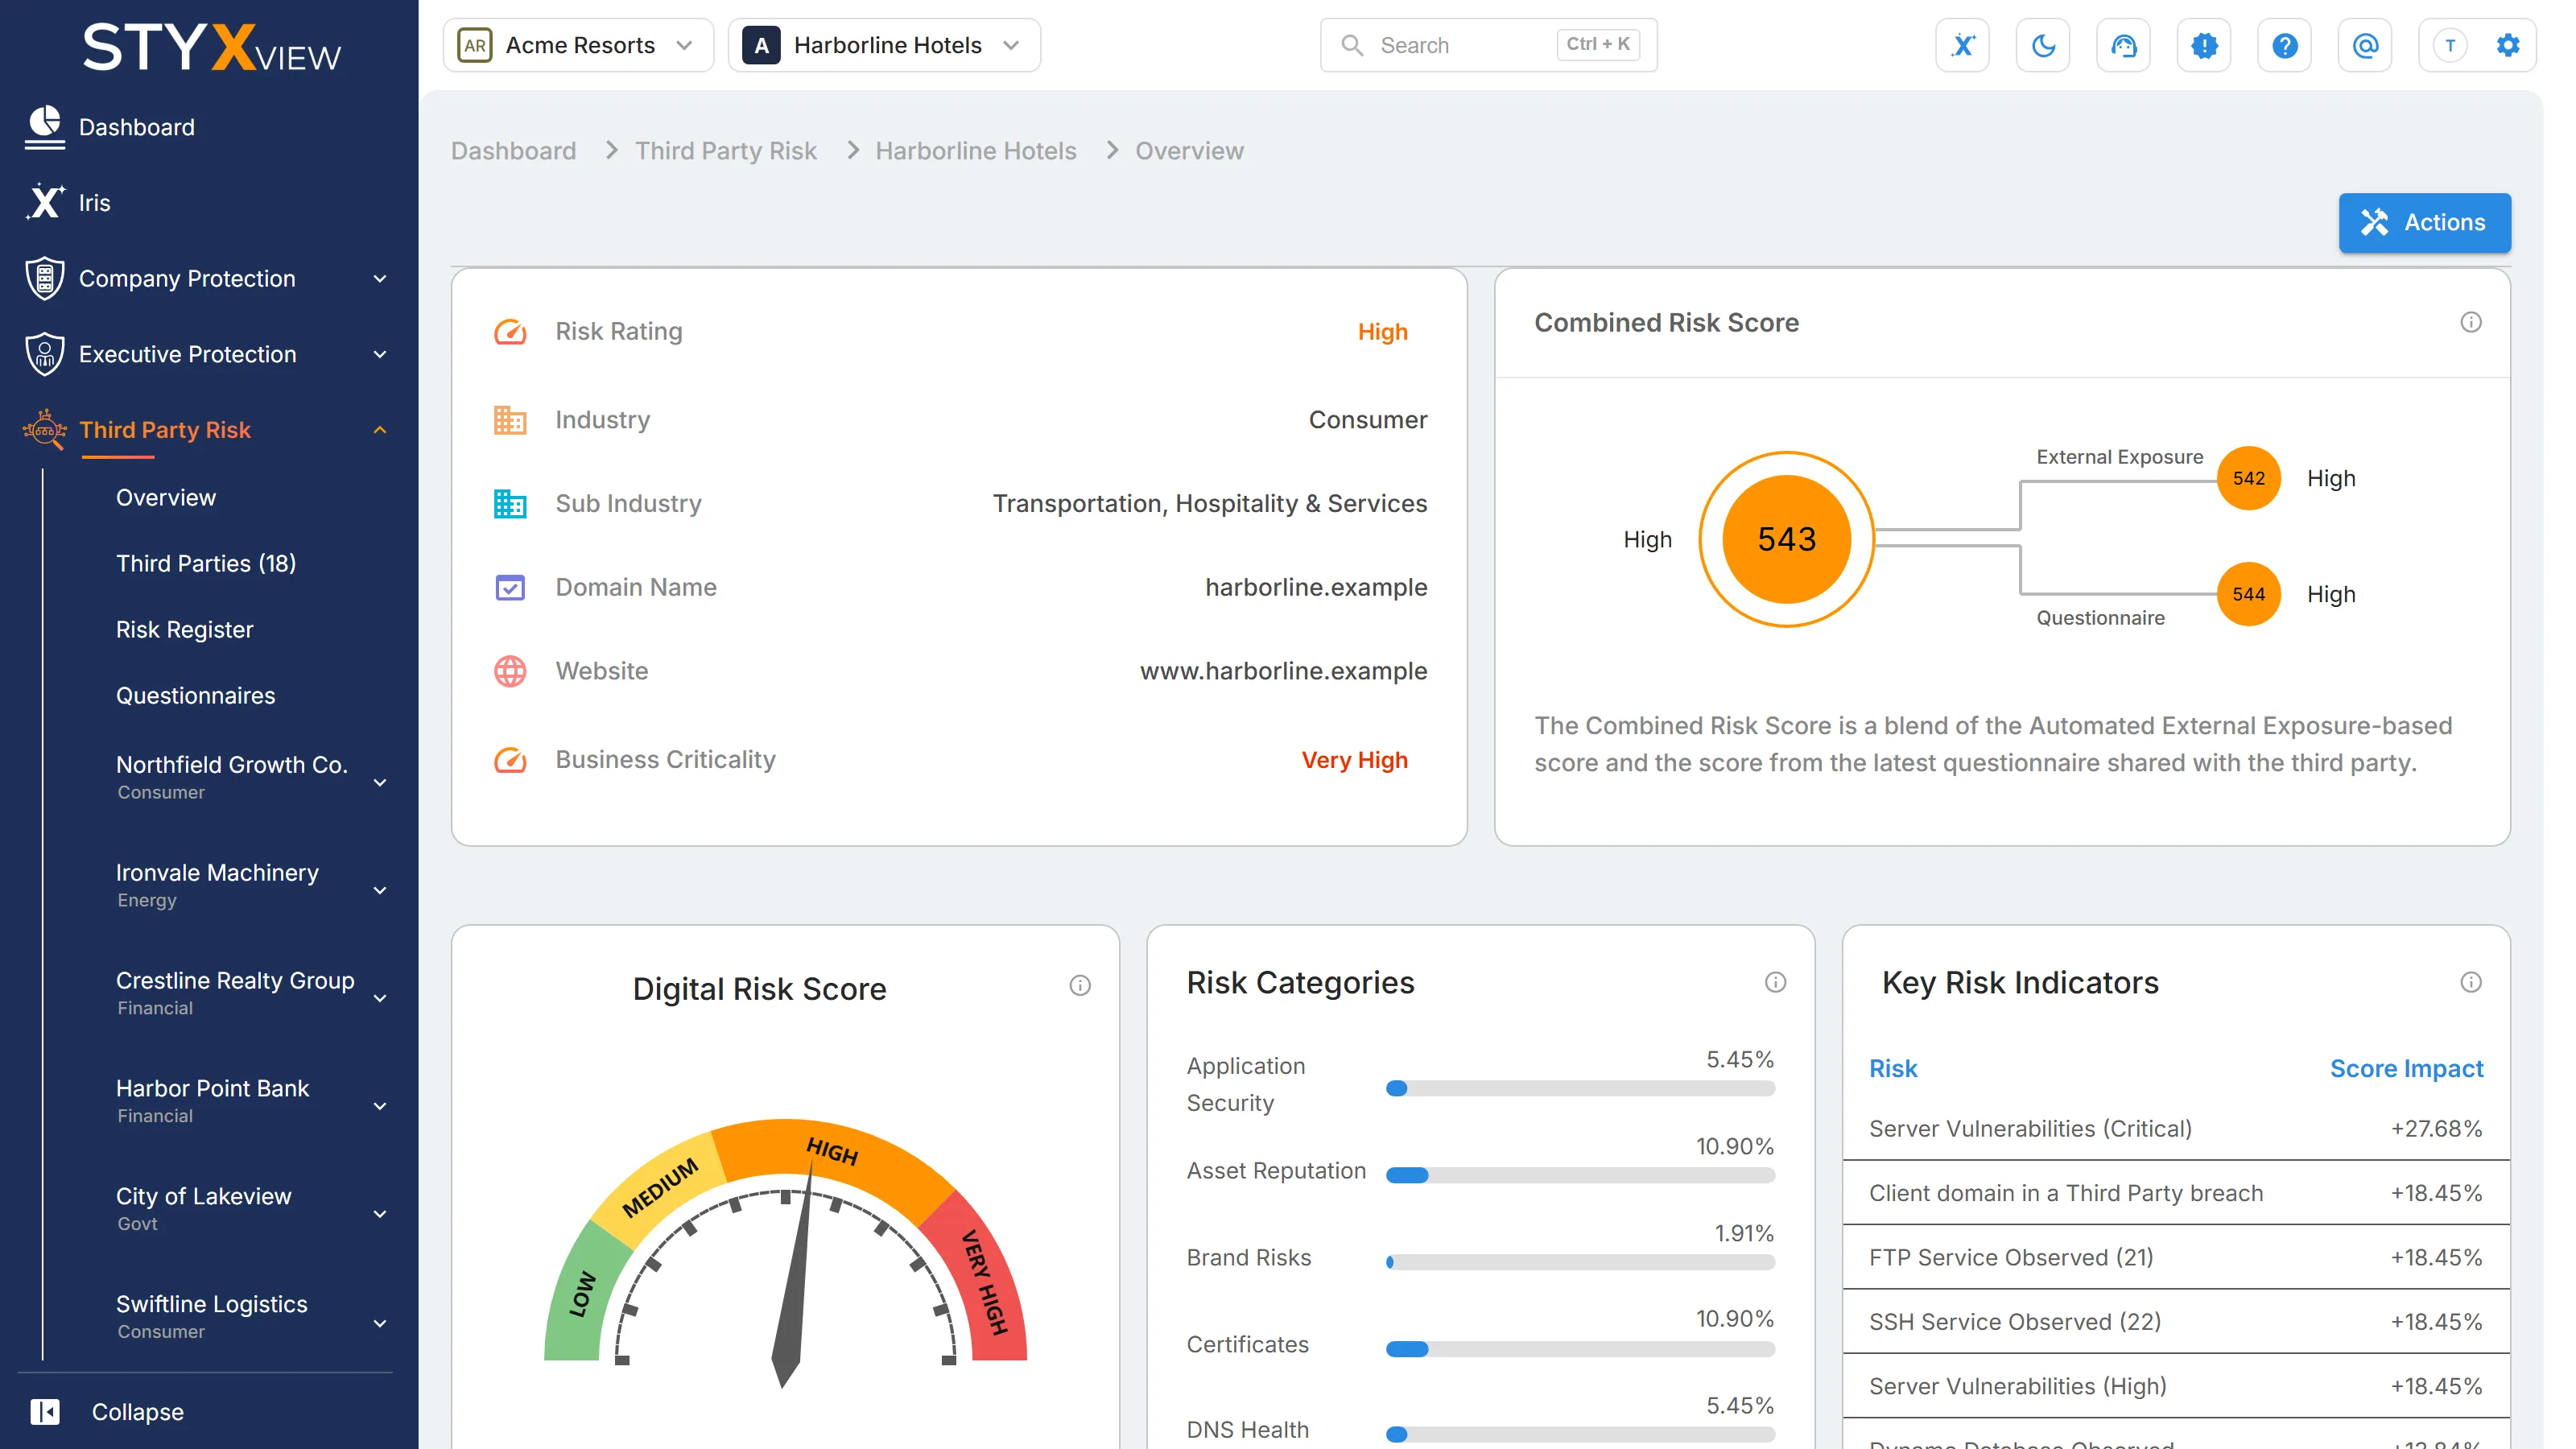
The top row shows the third party's lifecycle status and an "Actions" button. Below it:
- Details: "Risk Rating", "Industry", "Sub Industry", "Domain Name", "Website", and "Business Criticality".
- "Combined Risk Score": the overall score described below.
- "Digital Risk Score", "Risk Categories", and "Key Risk Indicators": the external monitoring results.
- "Asset Map" and four activity panels.
- "Risk Rating Over Time": the Digital Risk Score by day.
Combined Risk Score
Section titled “Combined Risk Score”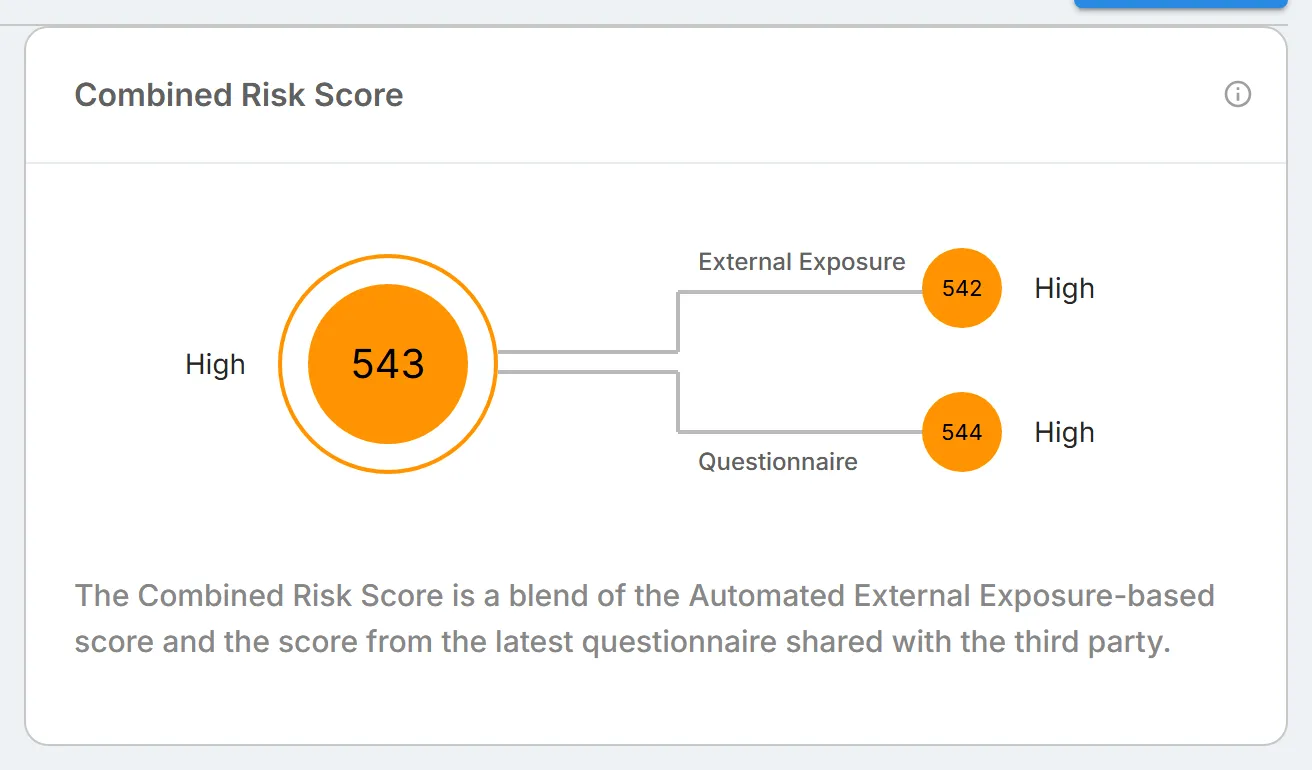
The Combined Risk Score is the third party's overall security posture on a scale of 0 to 1000, where higher means more risk. It combines two scores on the same scale:
- "External Exposure": the third party's Digital Risk Score, from StyxView's automated monitoring of its internet-facing assets.
- "Questionnaire": the official score of the most recently completed questionnaire for this third party. A questionnaire is scored only if its template has scoring configured. See Managing Questionnaire Responses and Feedback.
The combined score is the average of the two. If only one of them exists, the combined score equals that one. If neither exists, the card shows "No data".
Each score is rated with the same bands: "Low" from 0 to 199, "Medium" from 200 to 399, "High" from 400 to 749, and "Very High" from 750. Select the combined score to open the third party's "Risk Score" pages.
Digital Risk Score and risk categories
Section titled “Digital Risk Score and risk categories”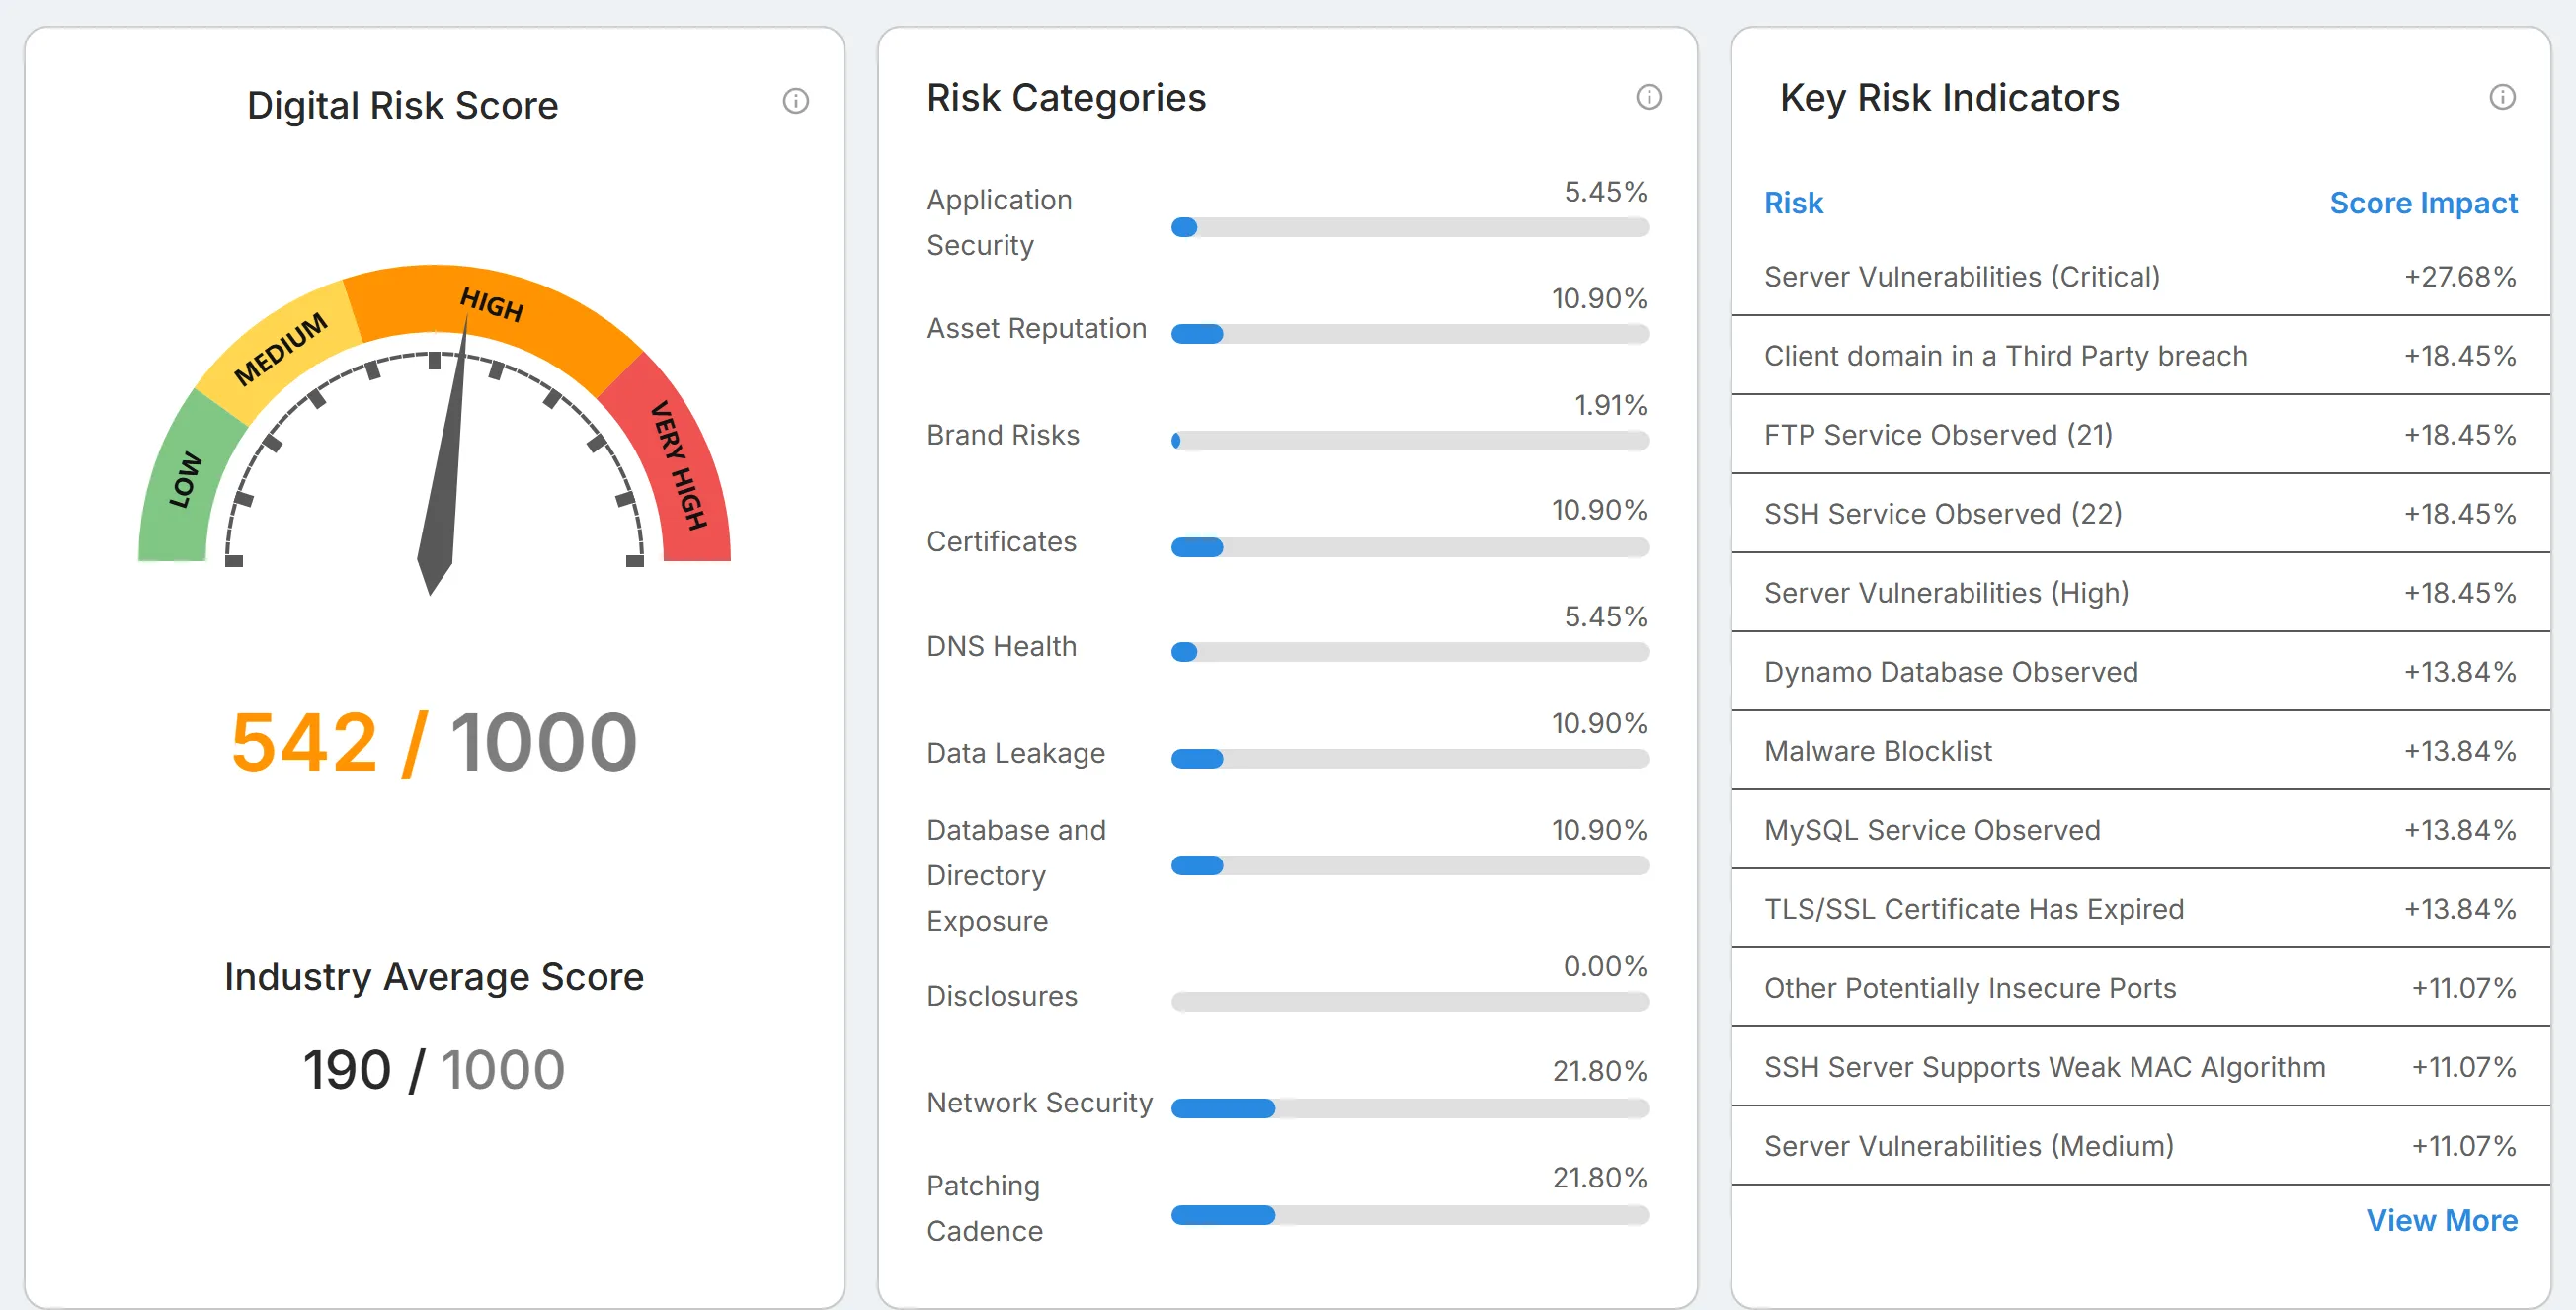
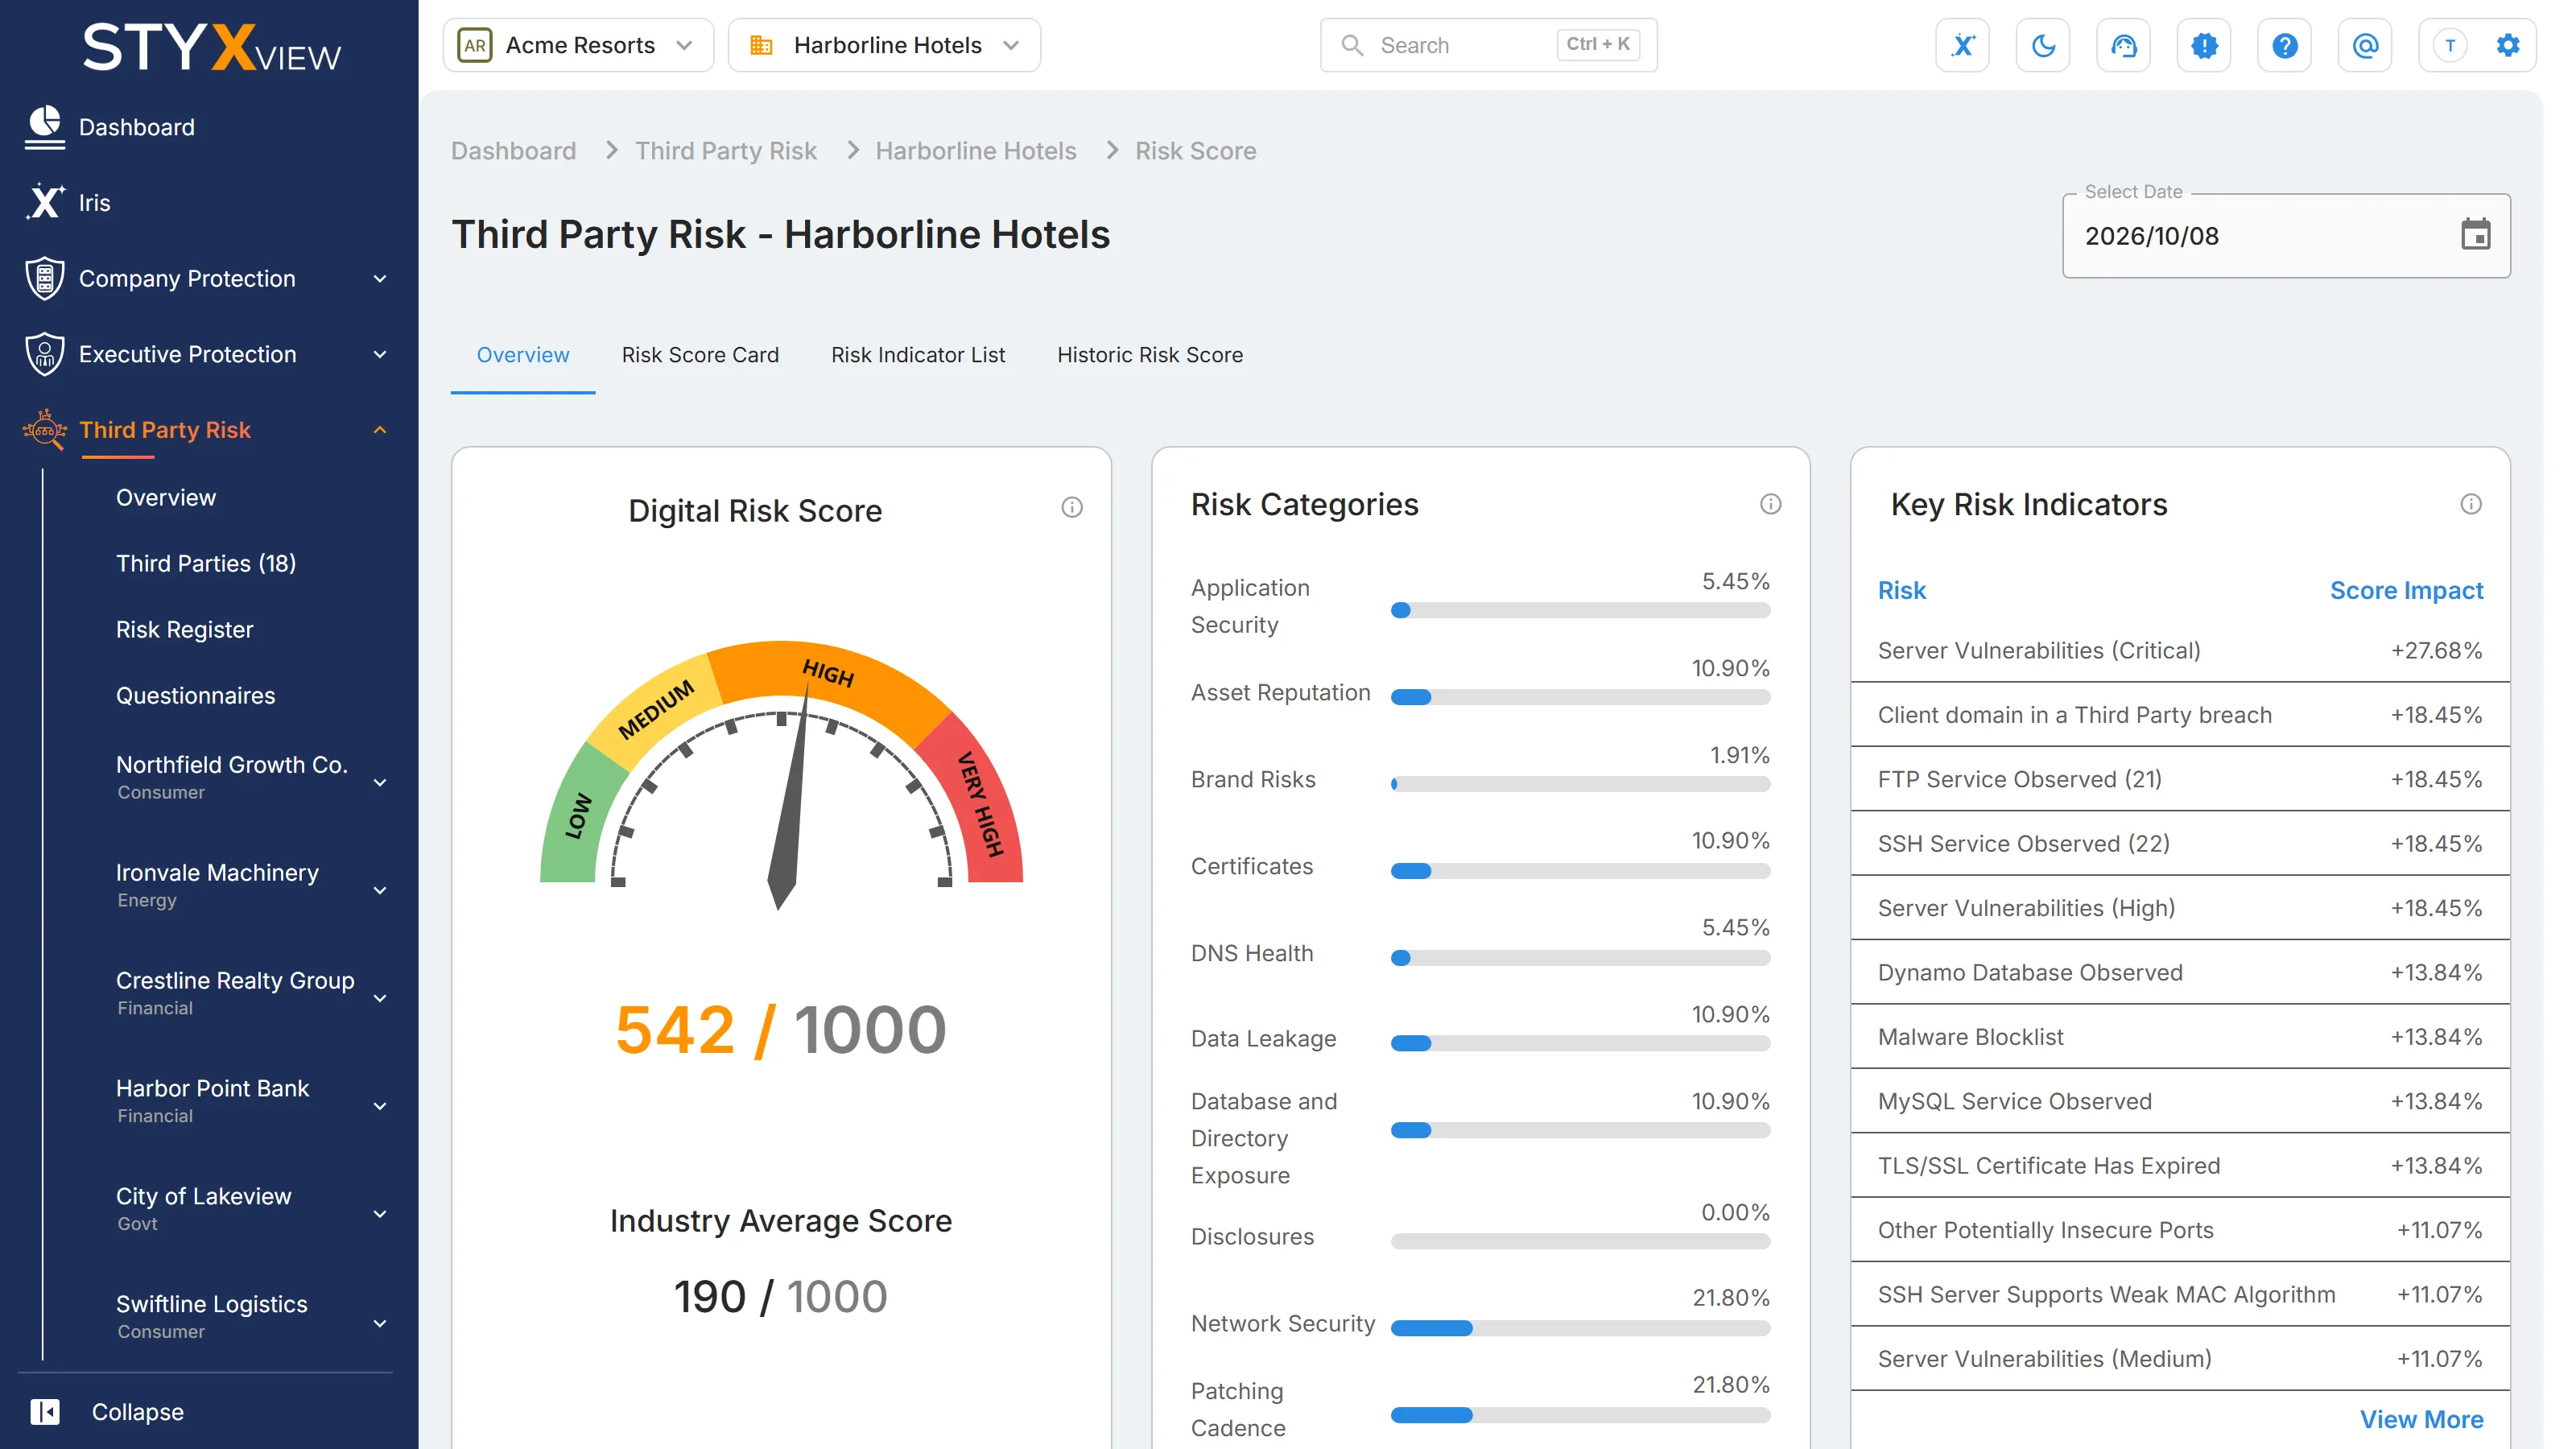
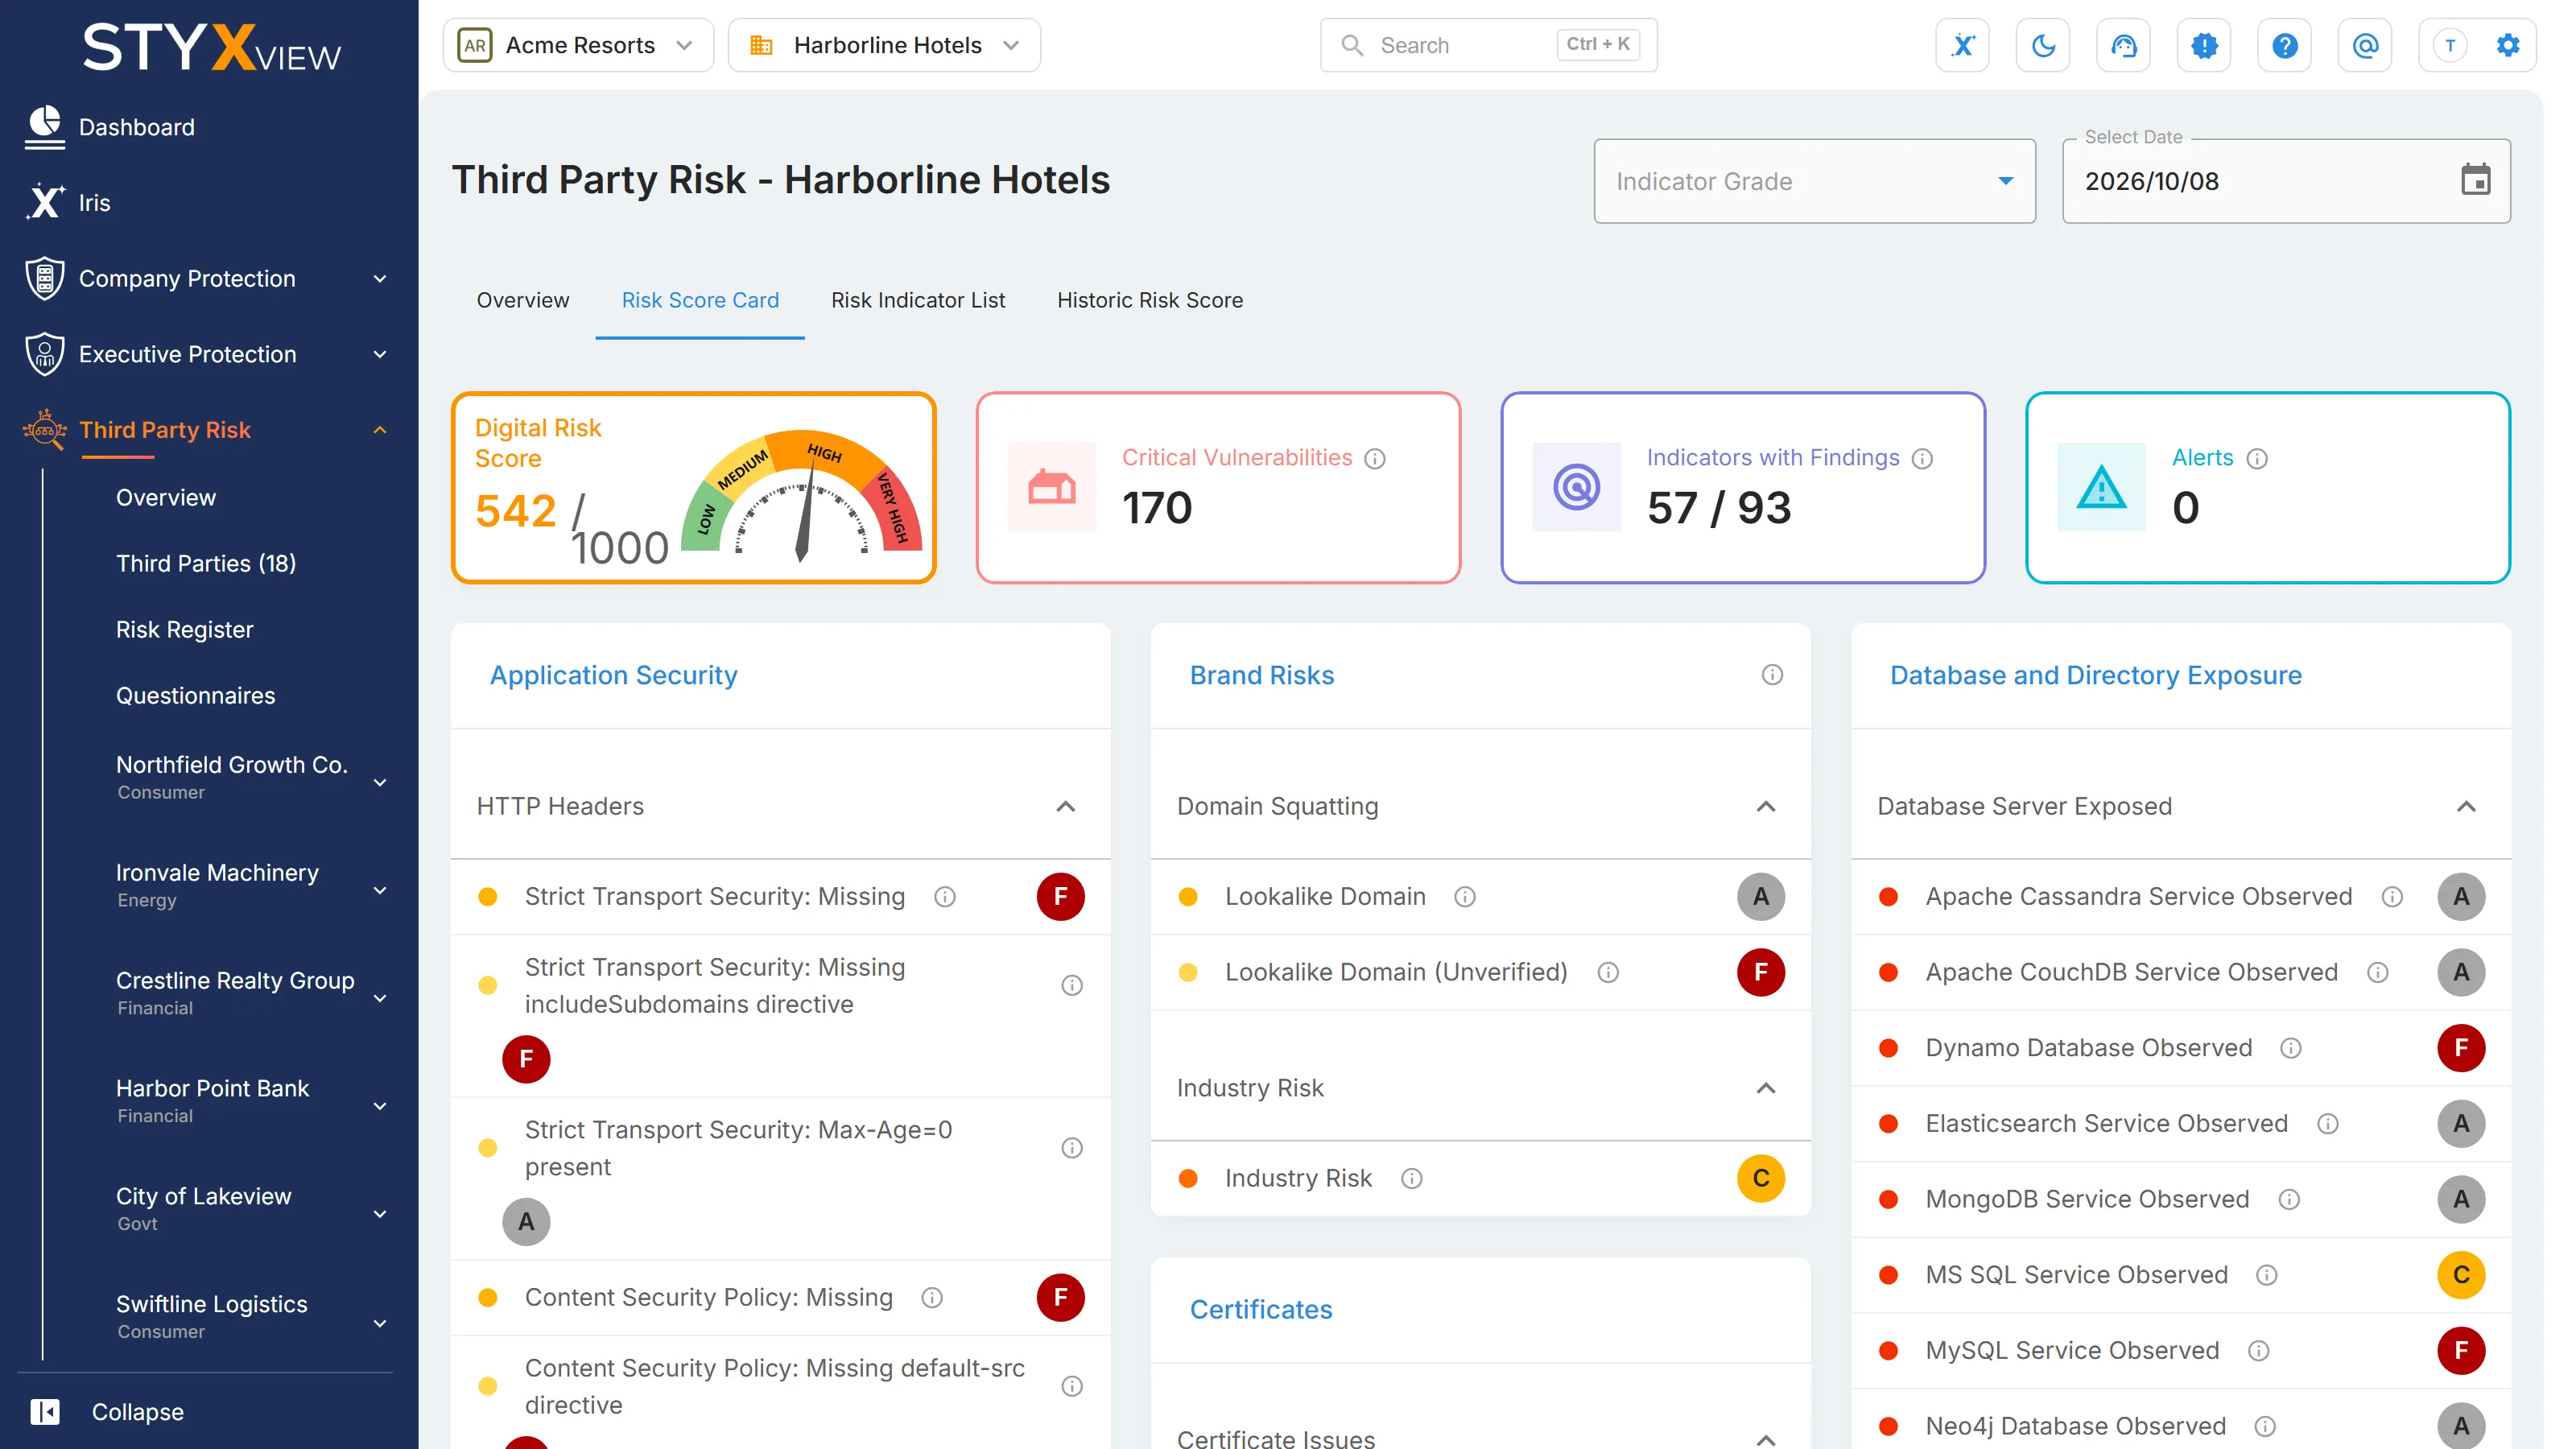
- "Digital Risk Score": a gauge showing the third party's current score out of 1000. "Industry Average Score" shows the average score in the third party's industry, for comparison. See Risk Score Card.
- "Risk Categories": each category's share of the score, as a percentage. Select a category to open the Third Party Risk Indicator List filtered to it. For the categories and their weights, see Risk Score Overview.
- "Key Risk Indicators": up to 12 indicators that add the most to the score, each with its "Score Impact" as a share of the score. Select "View More" to open the full Third Party Risk Indicator List.
Asset Map and activity summary
Section titled “Asset Map and activity summary”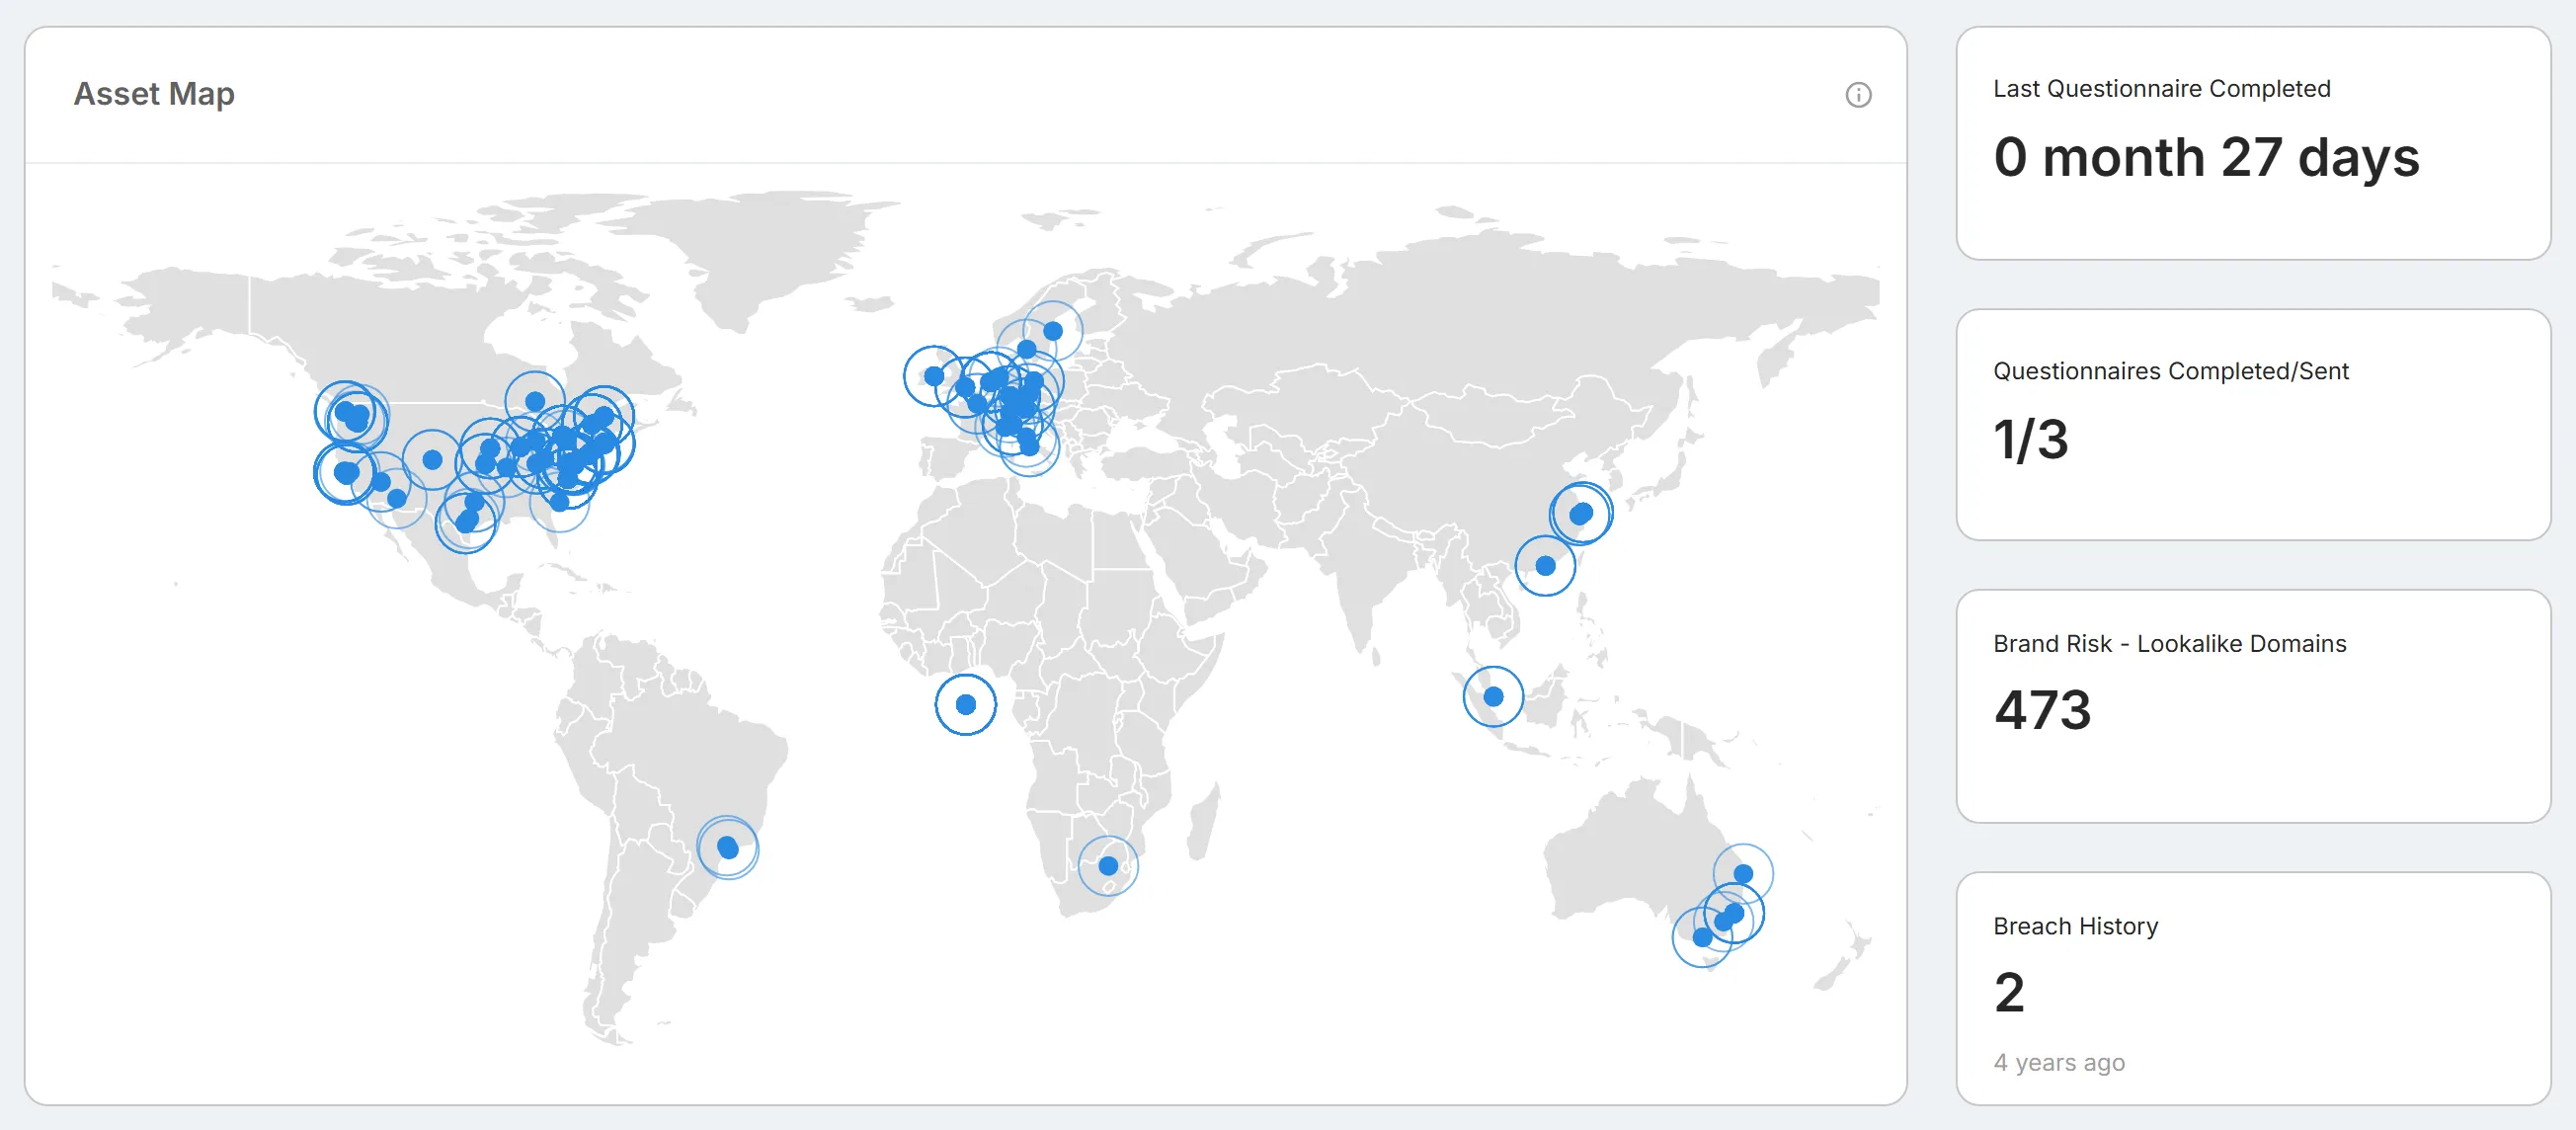
"Asset Map" plots the third party's detected IP addresses on a world map. Each circle is one or more assets in that region, sized by how many there are. Hover over a circle to see the IP address, its type, and its associated hosts. Use it to see where the third party's systems are hosted and where its risk is concentrated.
The four panels beside the map:
| Panel | What it shows |
|---|---|
| "Last Questionnaire Completed" | How long ago the most recent questionnaire for this third party was completed, or "N/A" if none has been. Select it to open "Questionnaires". |
| "Questionnaires Completed/Sent" | The number of completed questionnaires, then the number not yet completed. Select it to open "Questionnaires". |
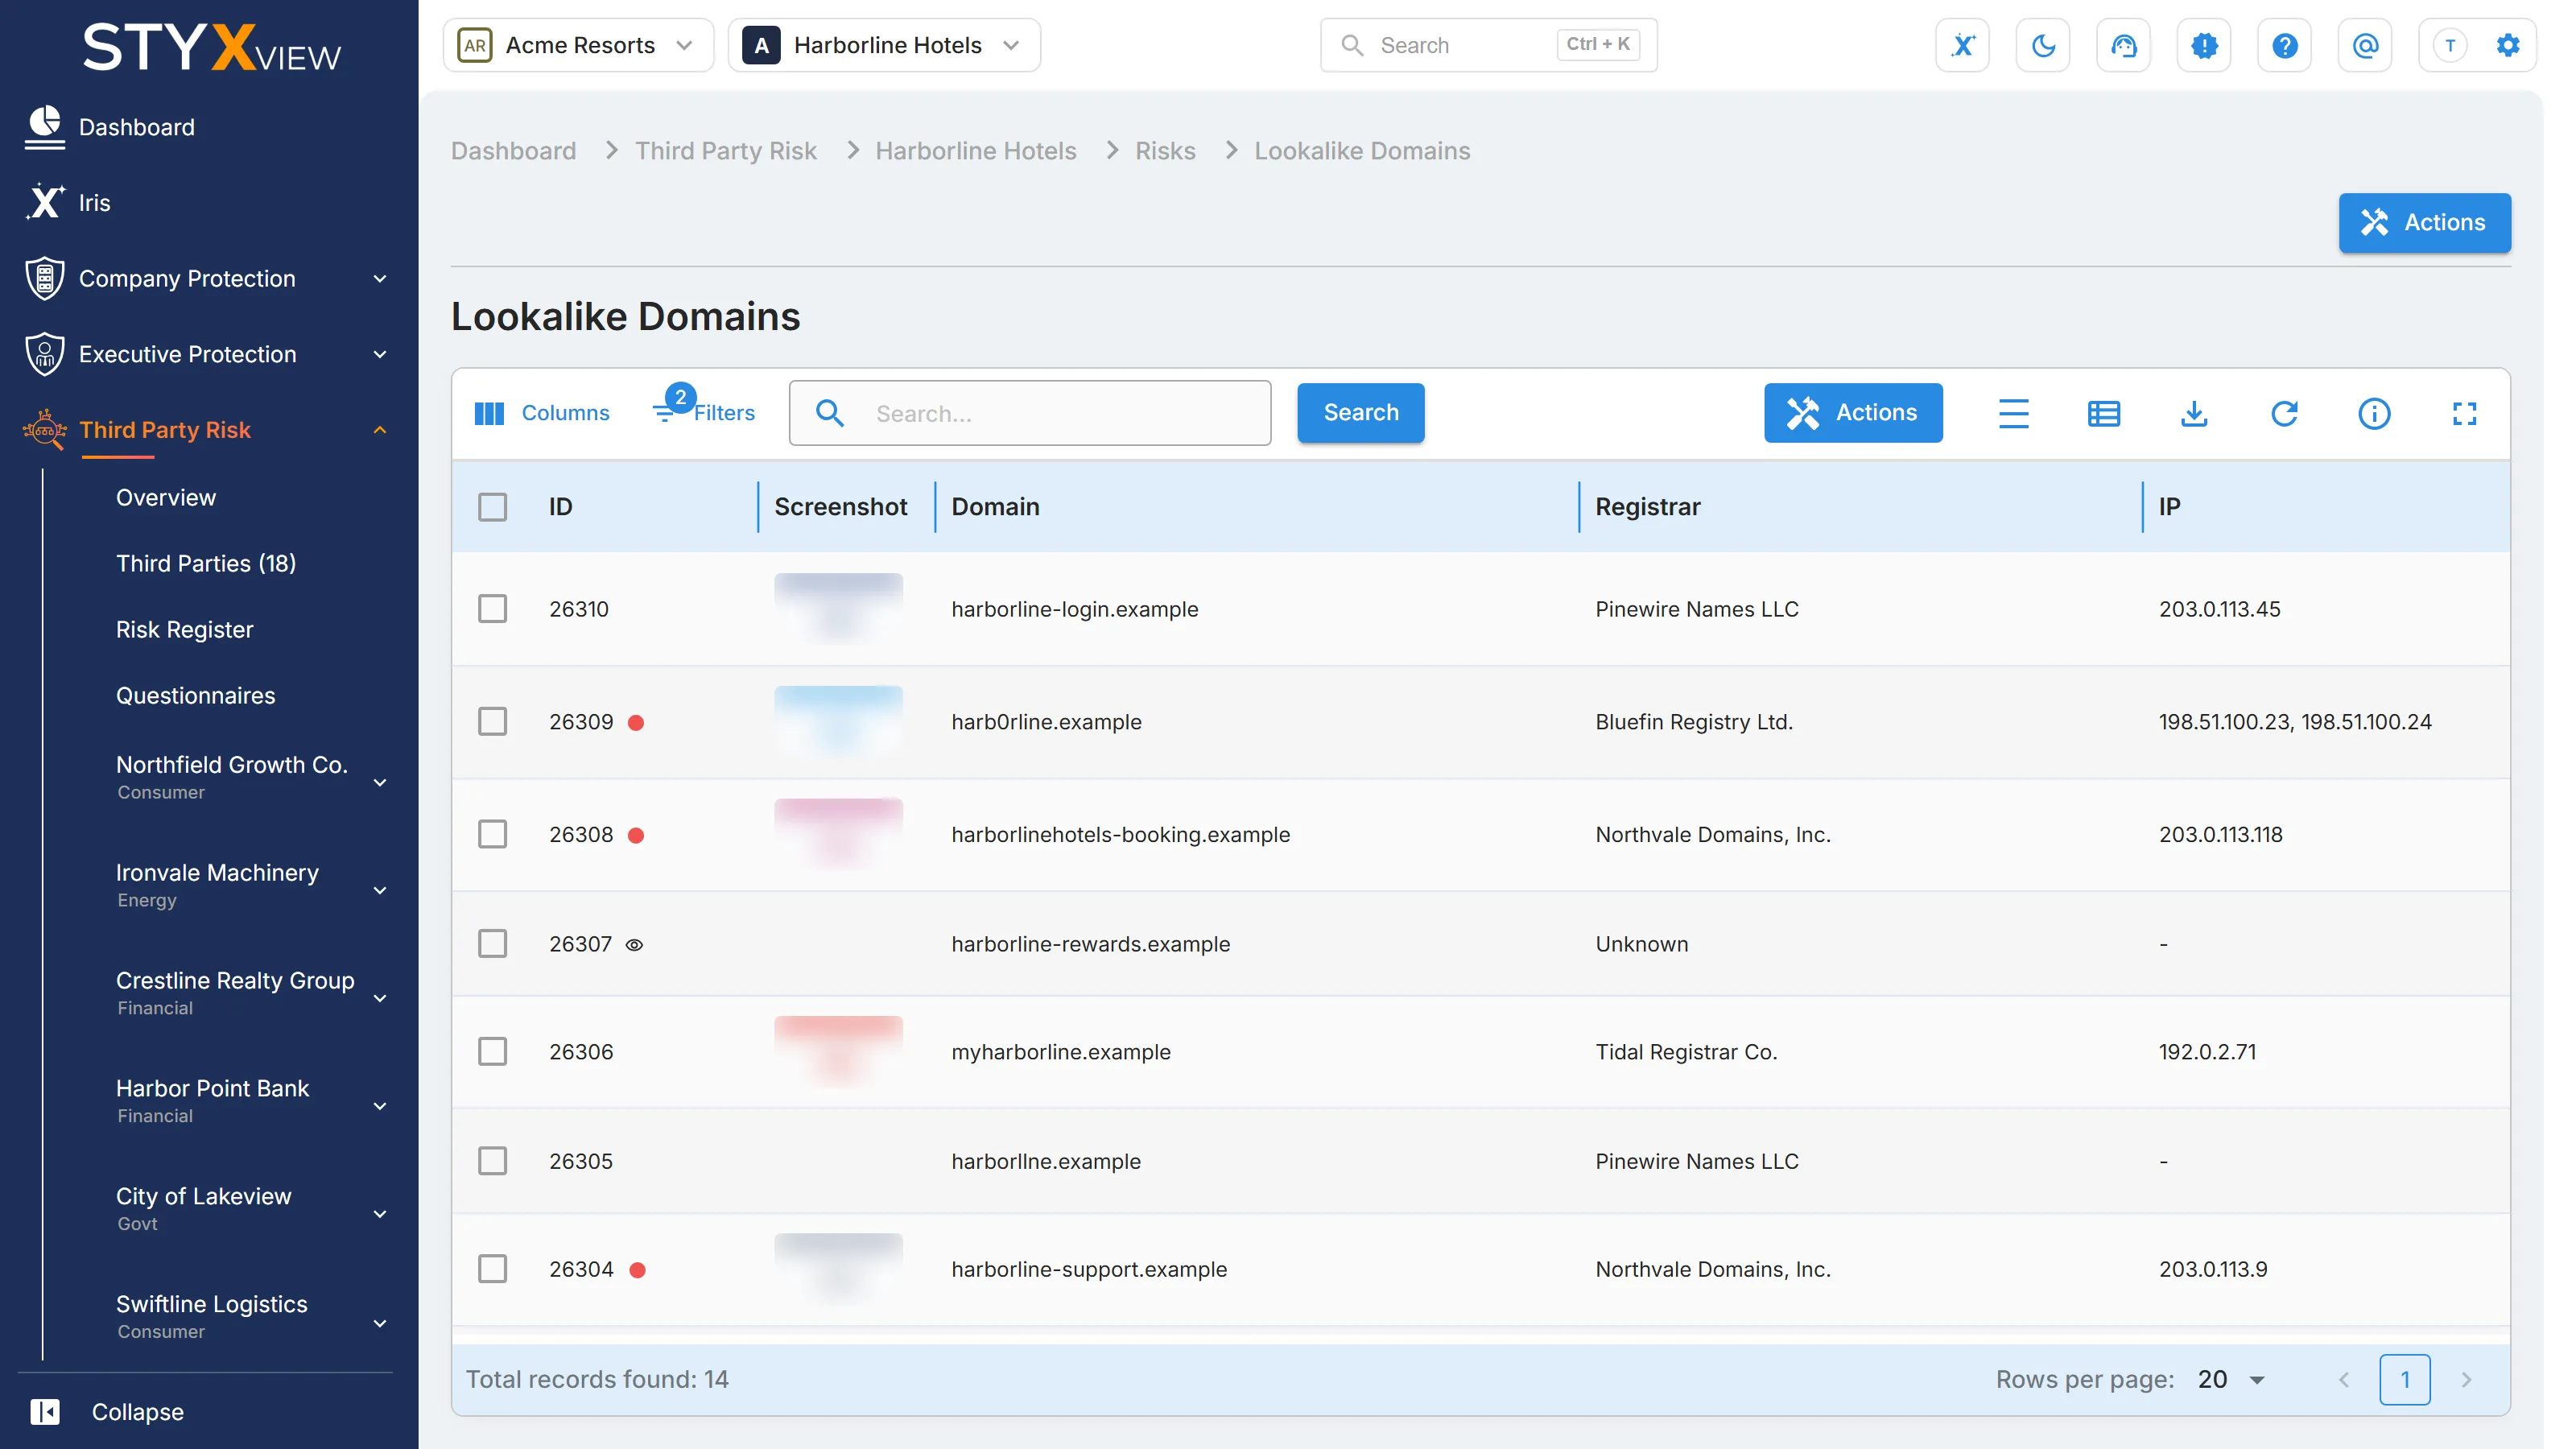
| "Brand Risk - Lookalike Domains" | The number of active lookalike domains imitating the third party's domains. A high number points to a higher risk of phishing or impersonation. Select it to open "Lookalike Domains". |
| "Breach History" | The number of the third party's domains found in data breaches, and how long ago the most recent was recorded. "No breaches recorded" means none were found. Select it to open "Breach Disclosure". |
Risk Rating Over Time
Section titled “Risk Rating Over Time”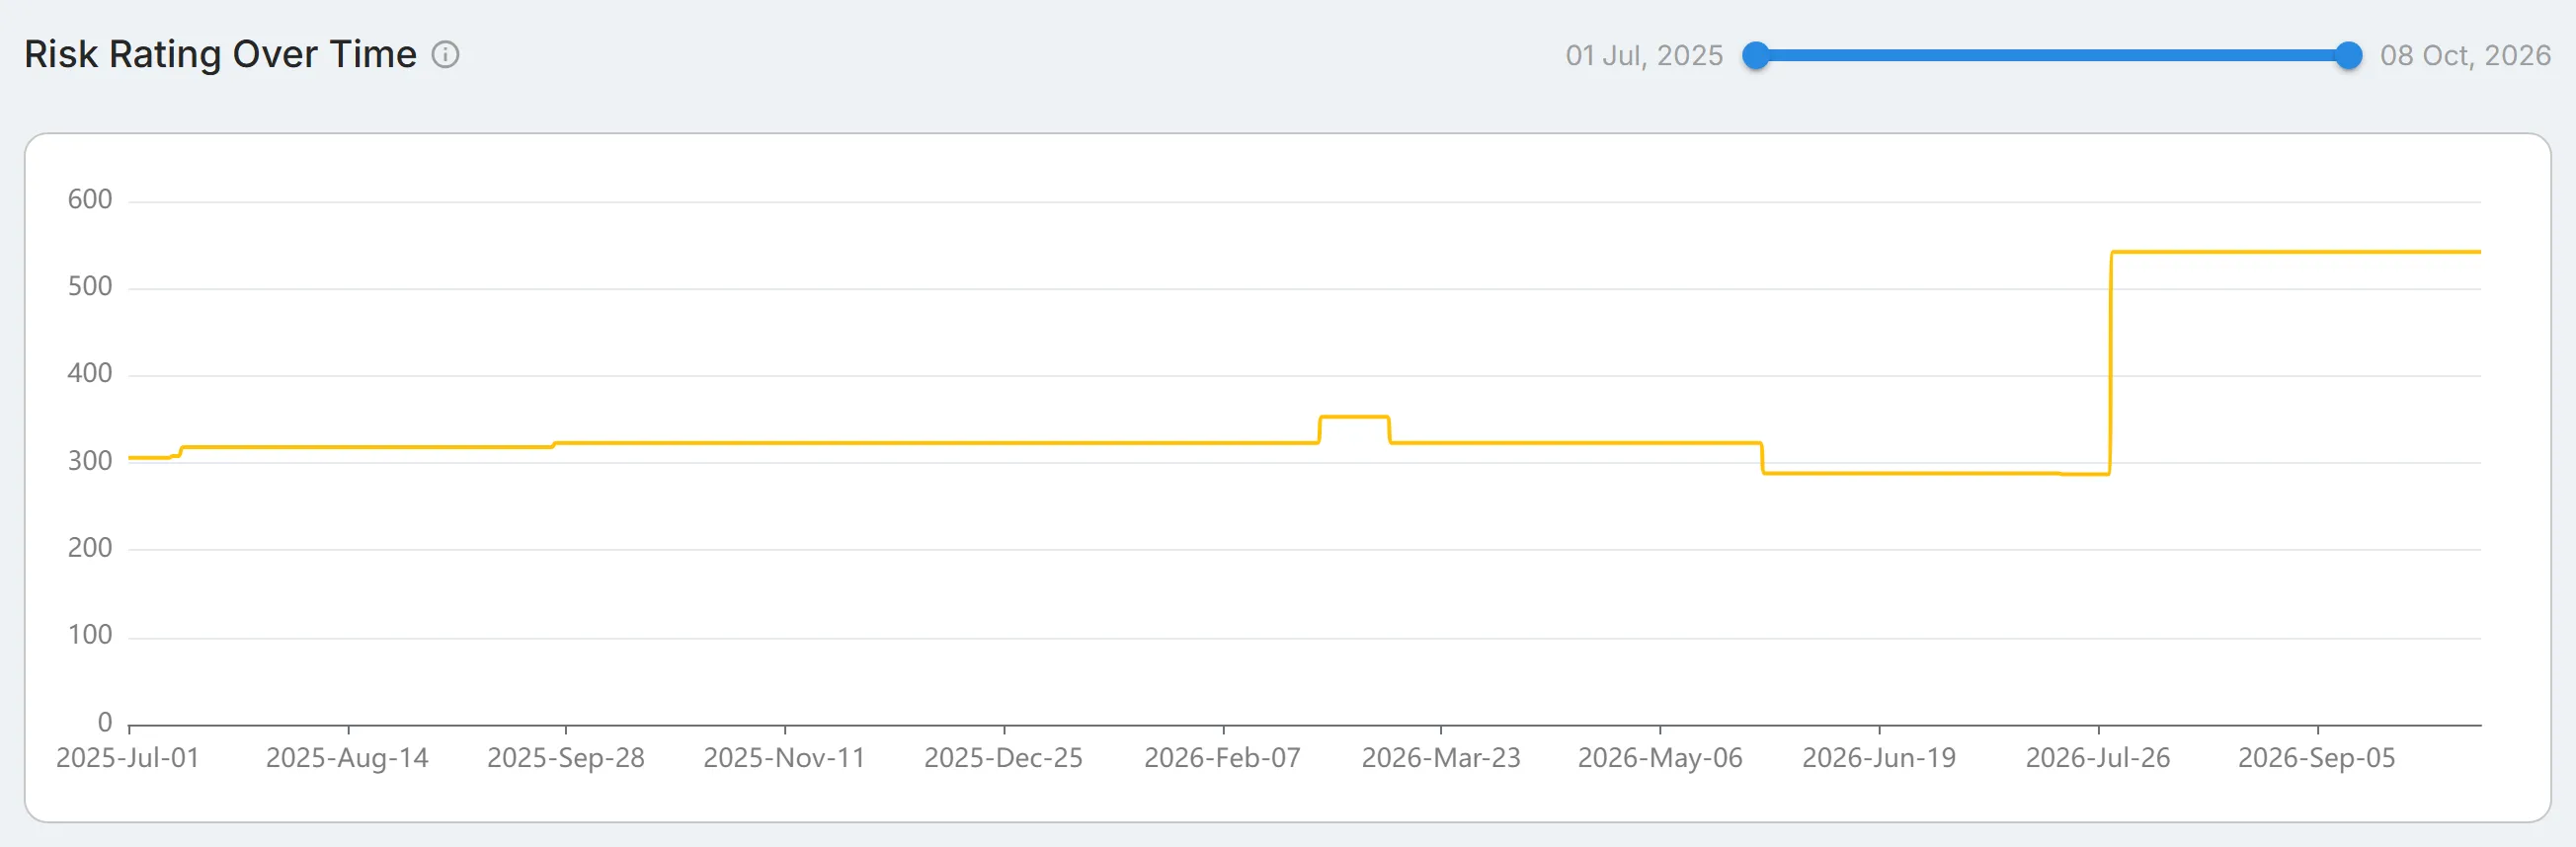
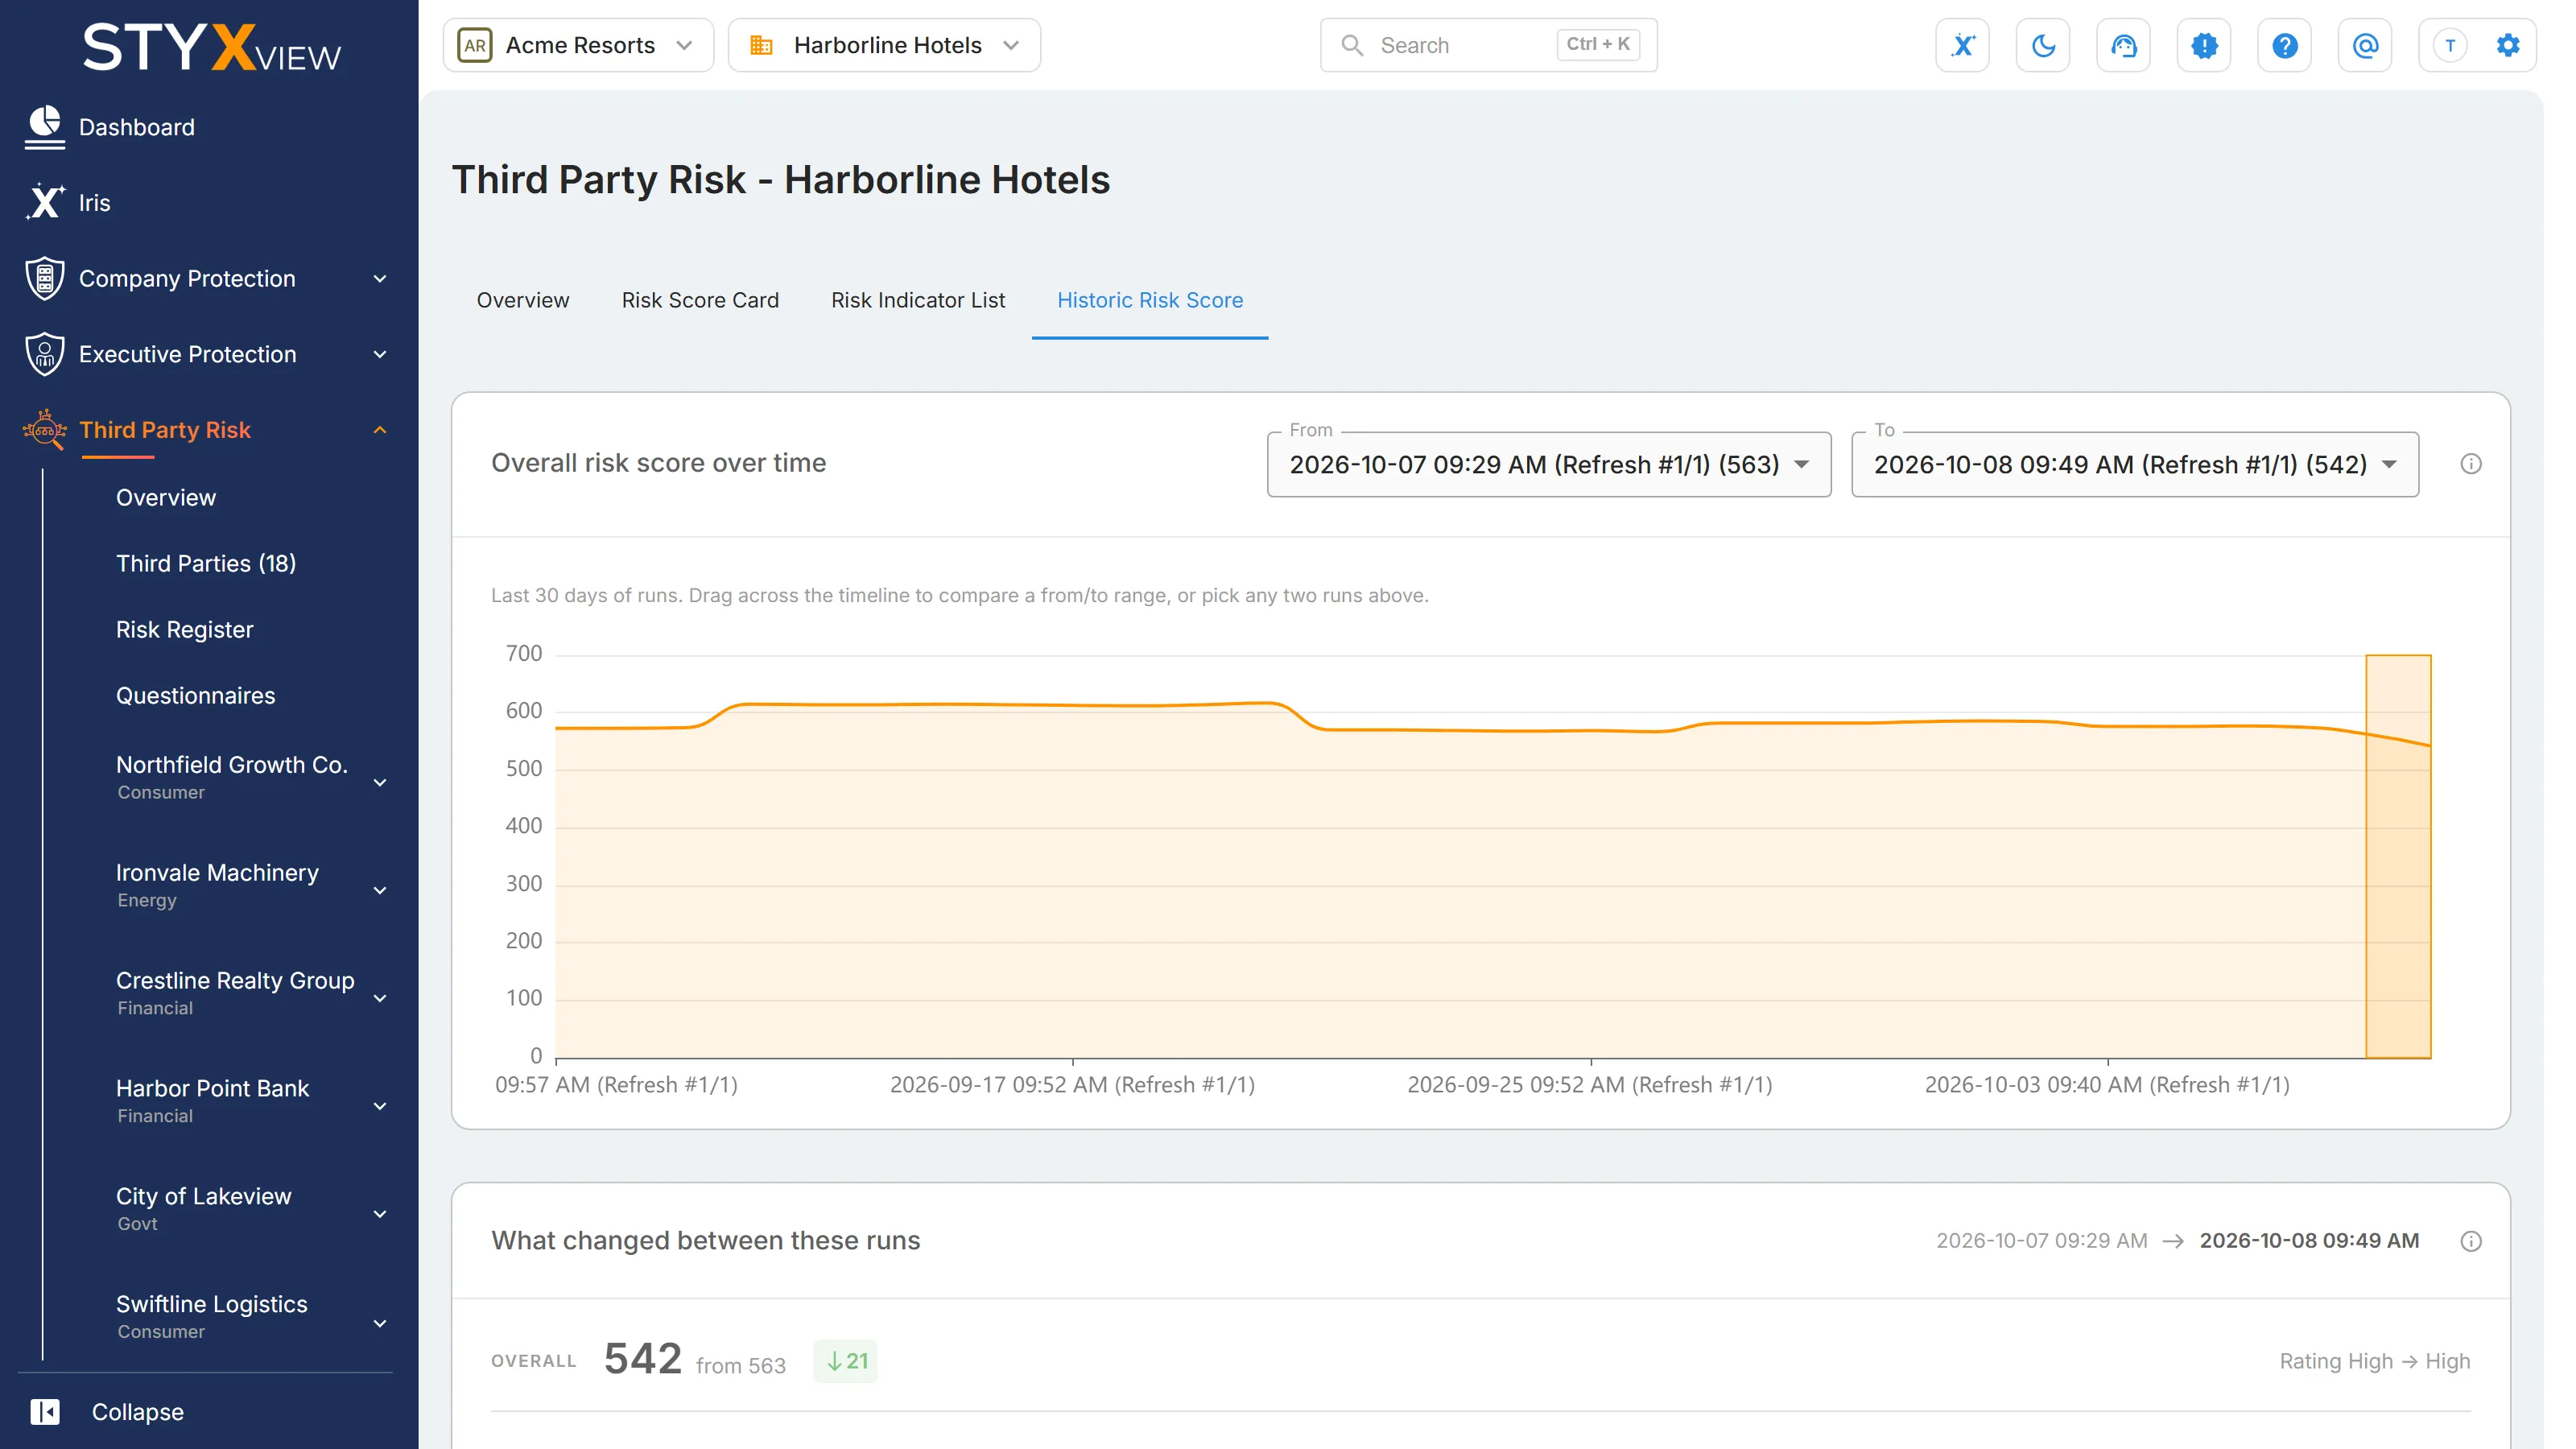
This chart shows the third party's Digital Risk Score for each day, so you can follow trends, confirm that remediation is working, or spot a deterioration.
- The horizontal axis is the date. The vertical axis is the Digital Risk Score.
- A rising line means more risk, for example from new vulnerabilities or other findings. A falling line means less risk, for example after remediation.
- Drag the ends of the slider above the chart to change the date range.
- Select a point on the line to open the third party's "Risk Score" for that date.
Changing lifecycle status, criticality, or description
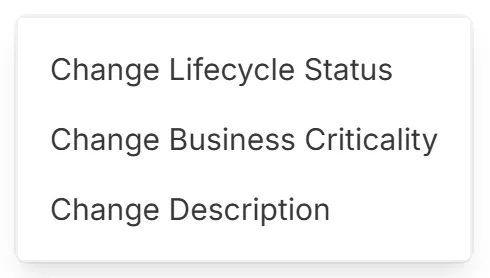
Section titled “Changing lifecycle status, criticality, or description”Select "Actions" at the top of the dashboard, then:
- "Change Lifecycle Status": pick a status in "Select Status" and, optionally, add "Comments". The statuses are described in Lifecycle statuses.
- "Change Business Criticality": pick "Very Low", "Low", "Medium", "High", or "Very High".
- "Change Description": edit the description of your relationship with the third party.
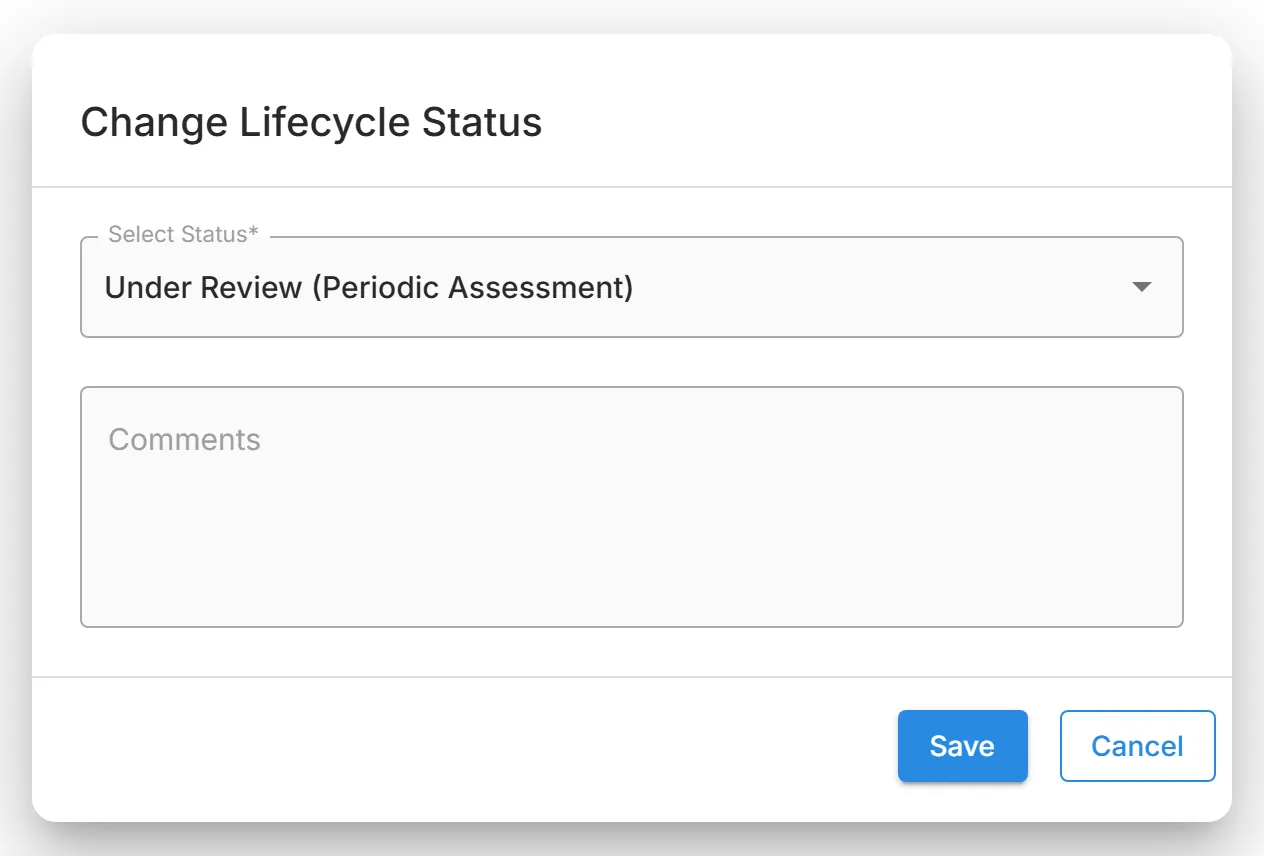
Select "Save" to apply the change.