
Dashboard
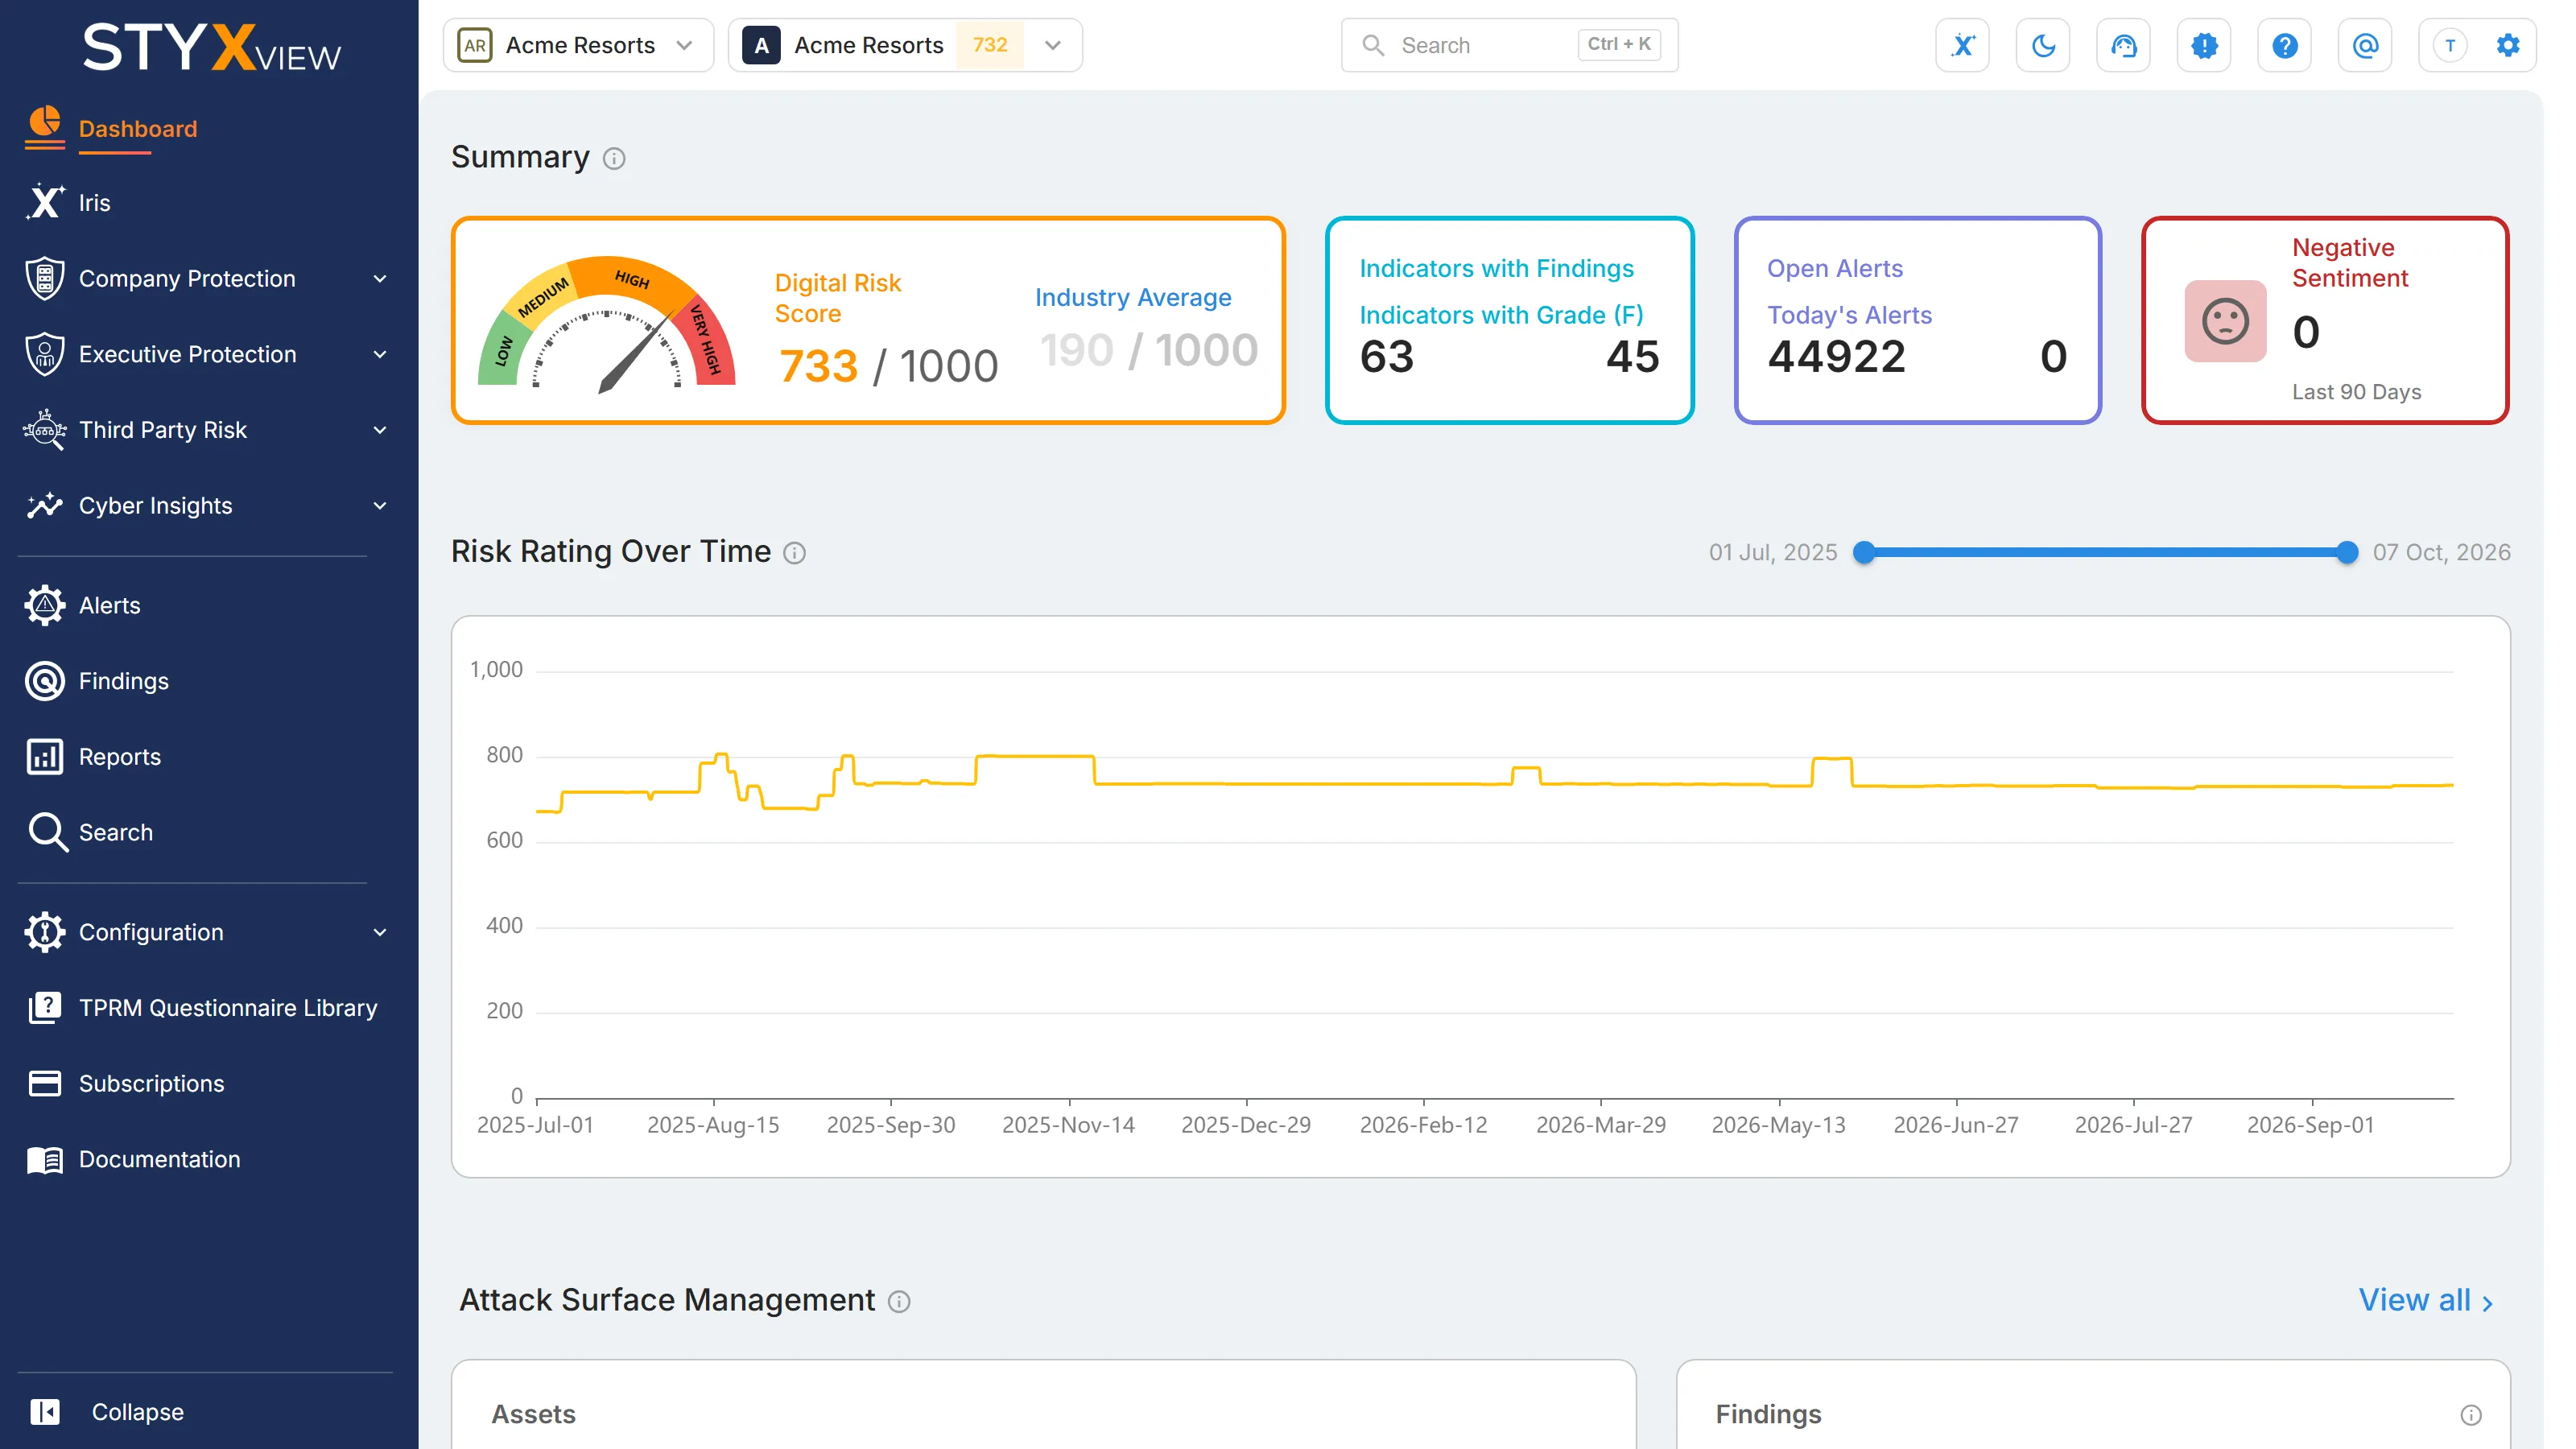
The dashboard is the StyxView home page. It brings together your Digital Risk Score, your alerts, and a summary of each module, and every number links to the page behind it. Select "Dashboard" in the sidebar to return to it from anywhere.
Each section appears only when your subscription includes the module behind it, so your dashboard may show fewer sections than this page describes.
Sidebar
Section titled “Sidebar”The sidebar lists the areas of StyxView. It shows only the modules your subscription includes, and "Search", "Configuration", and "Subscriptions" appear only for administrators.
| Item | What it opens |
|---|---|
| "Dashboard" | This page. |
| "Iris" | Iris, the StyxView AI assistant. |
| "Company Protection" | Your organization's overview, "Risk Score", and the Company Protection modules: "Attack Surface Management", "Brand Protection", "Social & News Monitoring", and "Data Leakage & Dark Web Detection". |
| "Executive Protection" | The executives you monitor. |
| "Third Party Risk" | The third parties you monitor, each with its own overview, risk score, assets, and risks. |
| "Cyber Insights" | Threat intelligence: news and advisories, vulnerabilities, breaches, and threat actors. |
| "Alerts" | Alerts raised by your alert rules. |
| "Findings" | Every finding across your modules in one list. |
| "Reports" | Scheduled and generated reports and exports. |
| "Search" | Searches the findings and events StyxView has collected. |
| "Configuration" | Users, groups, policies, alert rules, integrations, and other account settings. |
| "TPRM Questionnaire Library" | Questionnaire templates for your third parties. |
| "Subscriptions" | Your subscription. |
| "Documentation" | This documentation. |
Top Bar
Section titled “Top Bar”| Control | What it does |
|---|---|
| Account and project | On the left. Shows the account and project you are working in, and lets you switch to another. |
| "Search" | Searches pages and findings. Press Ctrl + K (⌘K on a Mac) to open it from anywhere. |
| Iris icon | Opens the Iris chat panel. |
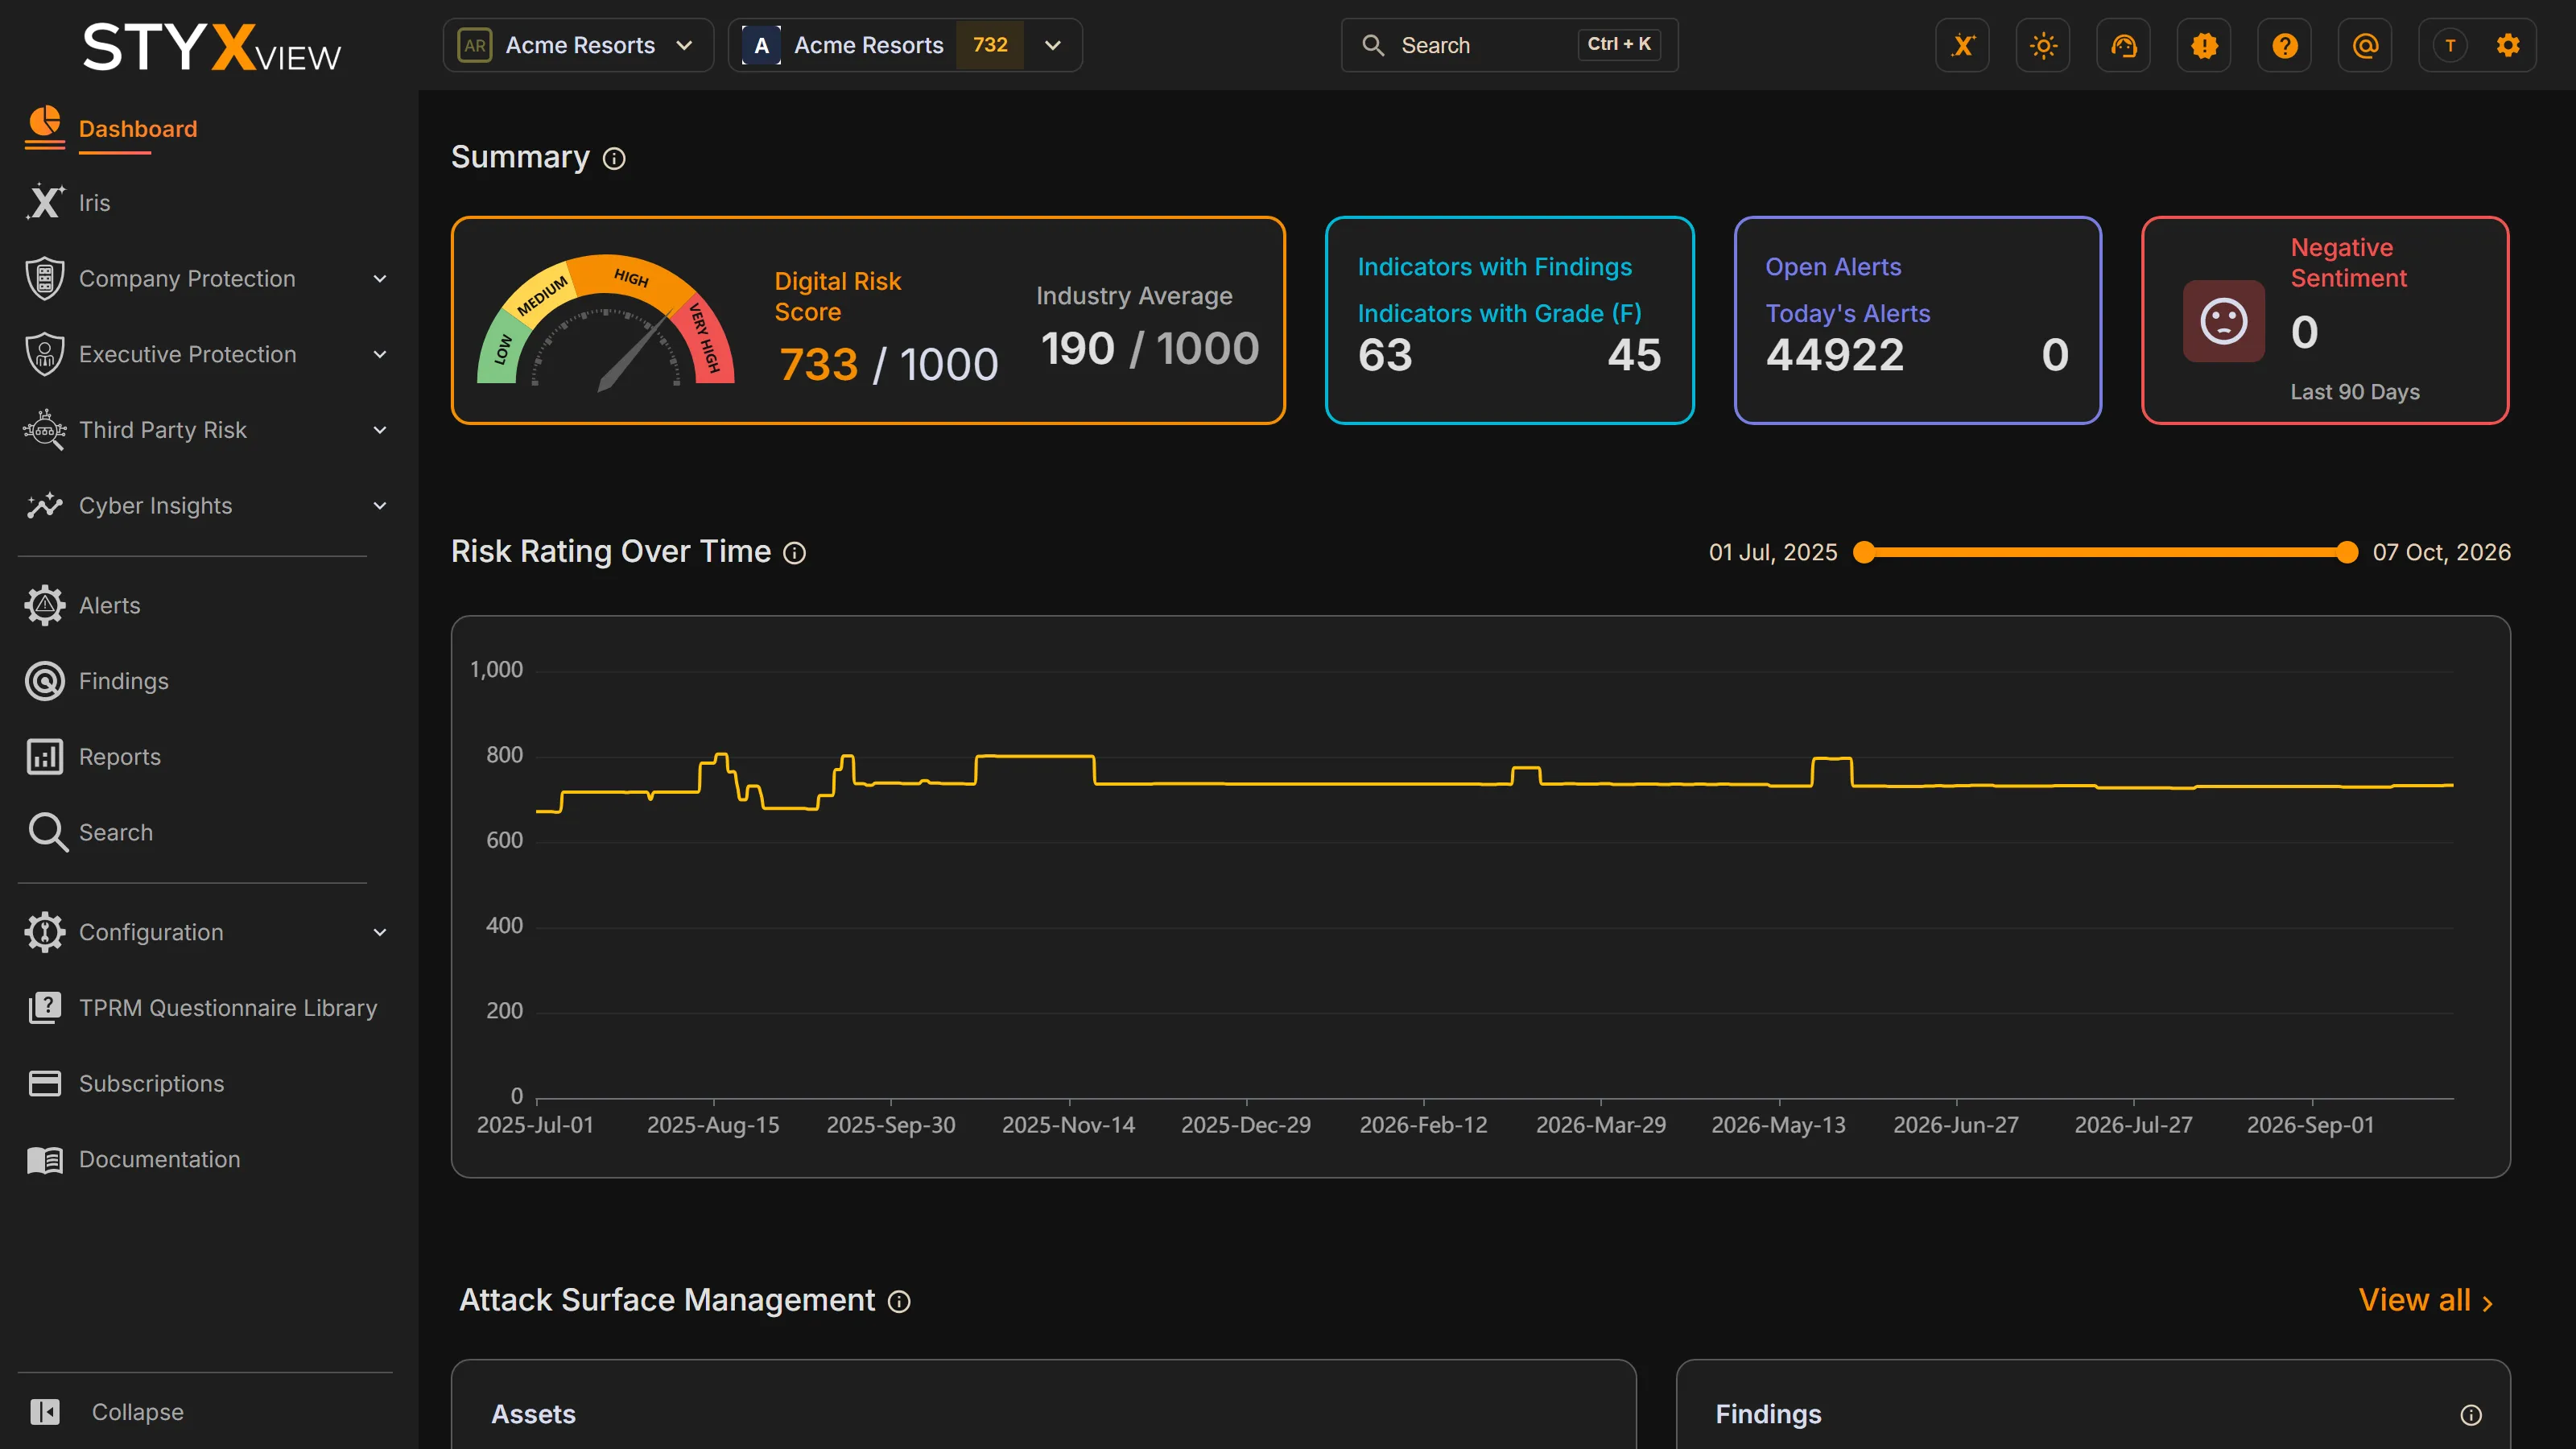
| Theme icon | Switches between light mode and dark mode. |
| "Support" | Opens the StyxView support portal in a new tab. |
| "Product Updates" | Shows recent product updates. |
| "Help" | Links to "About StyxView", the "User Manual", "Privacy", and "Terms of use". |
| "Contact Us" | Shows the Support Team's email address, StyxGuard@styxintel.com (opens in a new tab), with a button to copy it. |
| Profile icon | Opens your profile menu: "Account Settings" (update your personal information and change your password), "Language", and "Logout". |
On a narrow screen, "Support", "Product Updates", "Help", "Contact Us", and the theme switch move into the profile menu.
Summary
Section titled “Summary”The first row of the dashboard shows your headline numbers. It appears when your subscription includes Company Protection with Attack Surface Management.

| Tile | What it shows |
|---|---|
| "Digital Risk Score" | Your organization's current Digital Risk Score, from 0 to 1000. Higher is worse. The gauge and the tile border take the colour of the score's band: Low (0 to 199), Medium (200 to 399), High (400 to 749), or Very High (750 to 1000). Select the score to open the Risk Score page. The tile shows "N/A" until your first score is calculated. |
| "Industry Average" | The average score of the organisations StyxView monitors in your industry, on the same 0 to 1000 scale. |
| "Indicators with Findings" | How many risk indicators currently have findings, that is, a grade from B to F. Select it to open the Risk Score Card. |
| "Indicators with Grade (F)" | How many risk indicators have the worst grade, F. Select it to open the Risk Score Card. |
| "Open Alerts" | Alerts with the status Open, across the modules in your subscription. Select it to open Alerts filtered to open alerts. |
| "Today's Alerts" | Alerts raised today. Select it to open Alerts filtered to today. |
| "Negative Sentiment" | Social media posts and news articles about your organization with negative sentiment in the last 90 days, excluding false positives. Select it to open them in Search Social & News. |
Risk Rating Over Time
Section titled “Risk Rating Over Time”This line chart shows your Digital Risk Score over time. Each point is one scoring run.
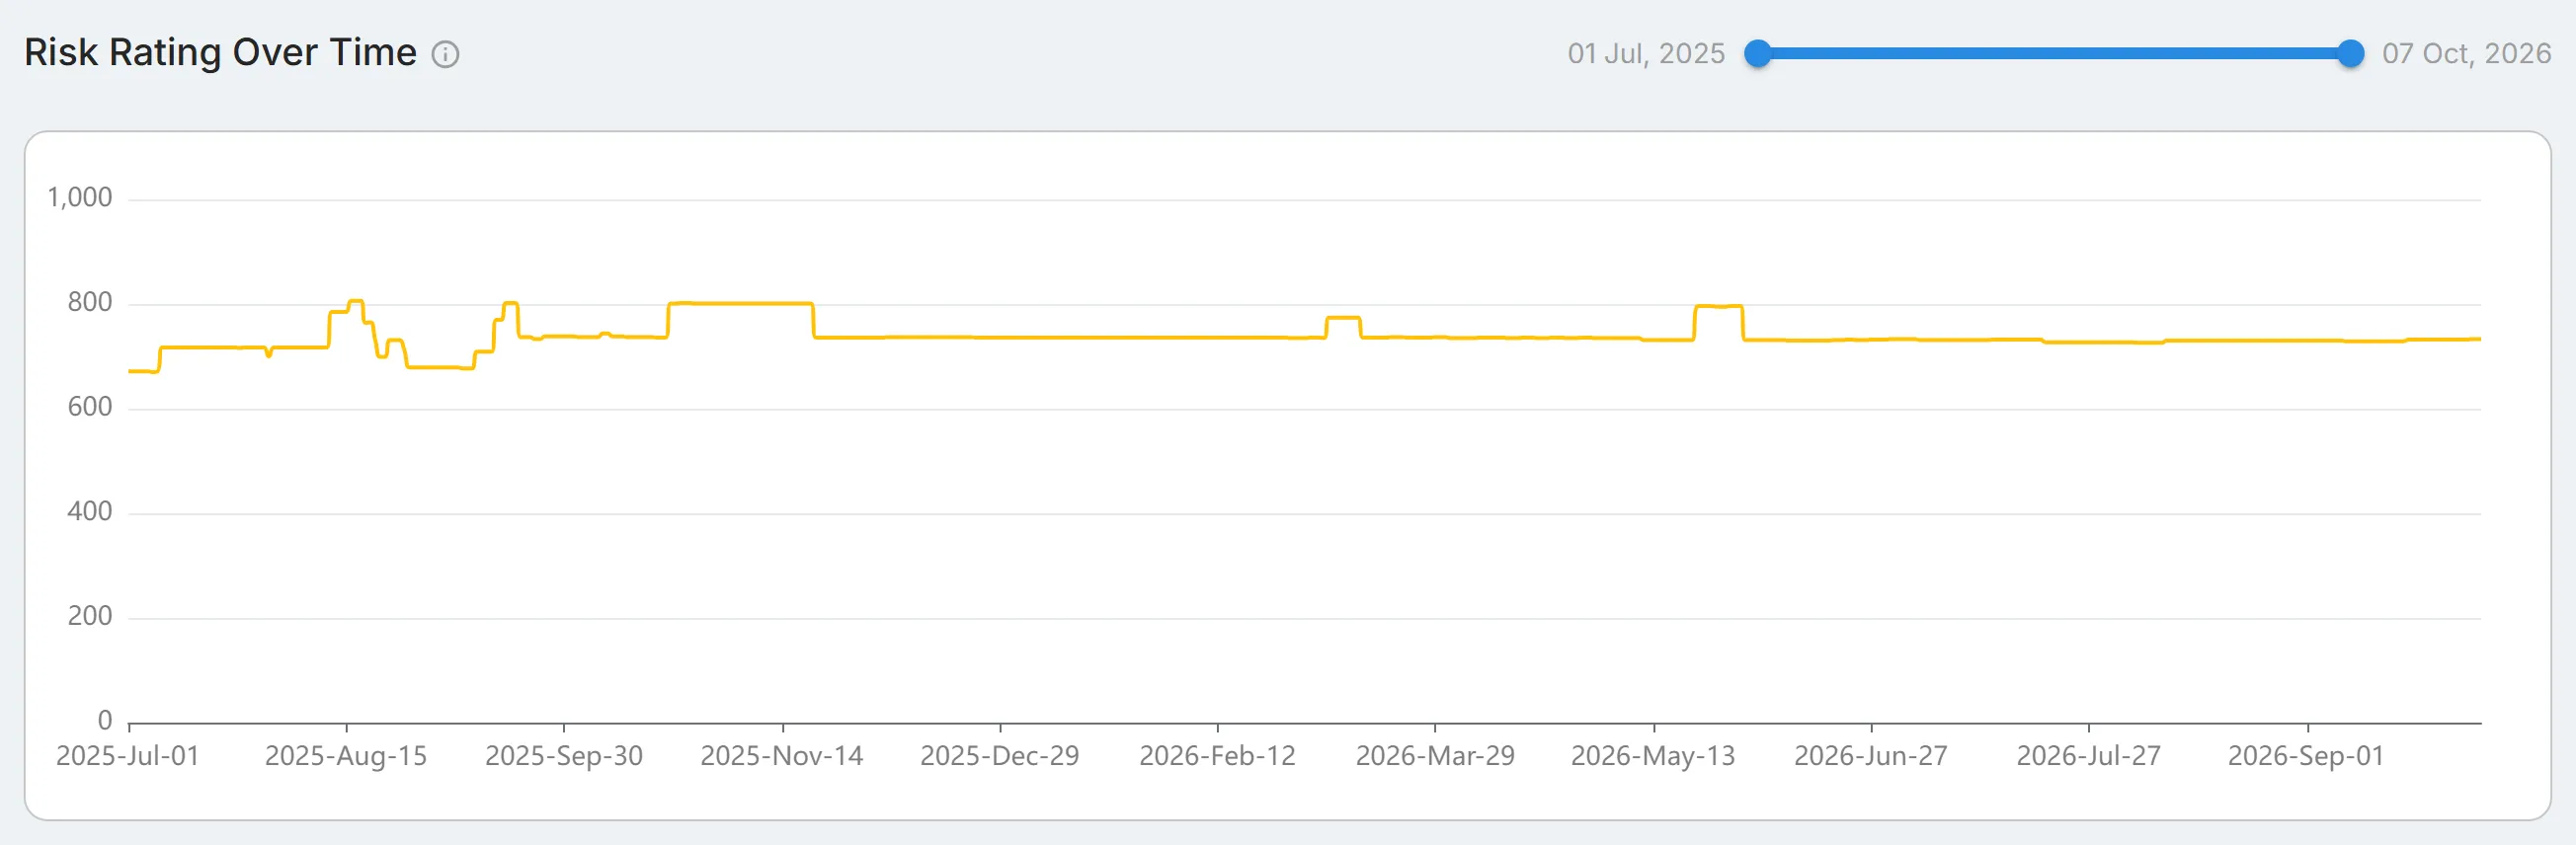
- Drag the handles of the slider above the chart to narrow the date range. The dates on either side of the slider show the range you have selected.
- Hover over a point to see its date and score.
- Select a point to open the Risk Score page for that date.
A rise means your risk increased; a fall means it decreased. The Historic Risk Score tab shows which indicators changed between two runs.
Attack Surface Management
Section titled “Attack Surface Management”This section shows your internet-facing assets and the findings on them. Select "View all" to open the Attack Surface Management overview.
Assets
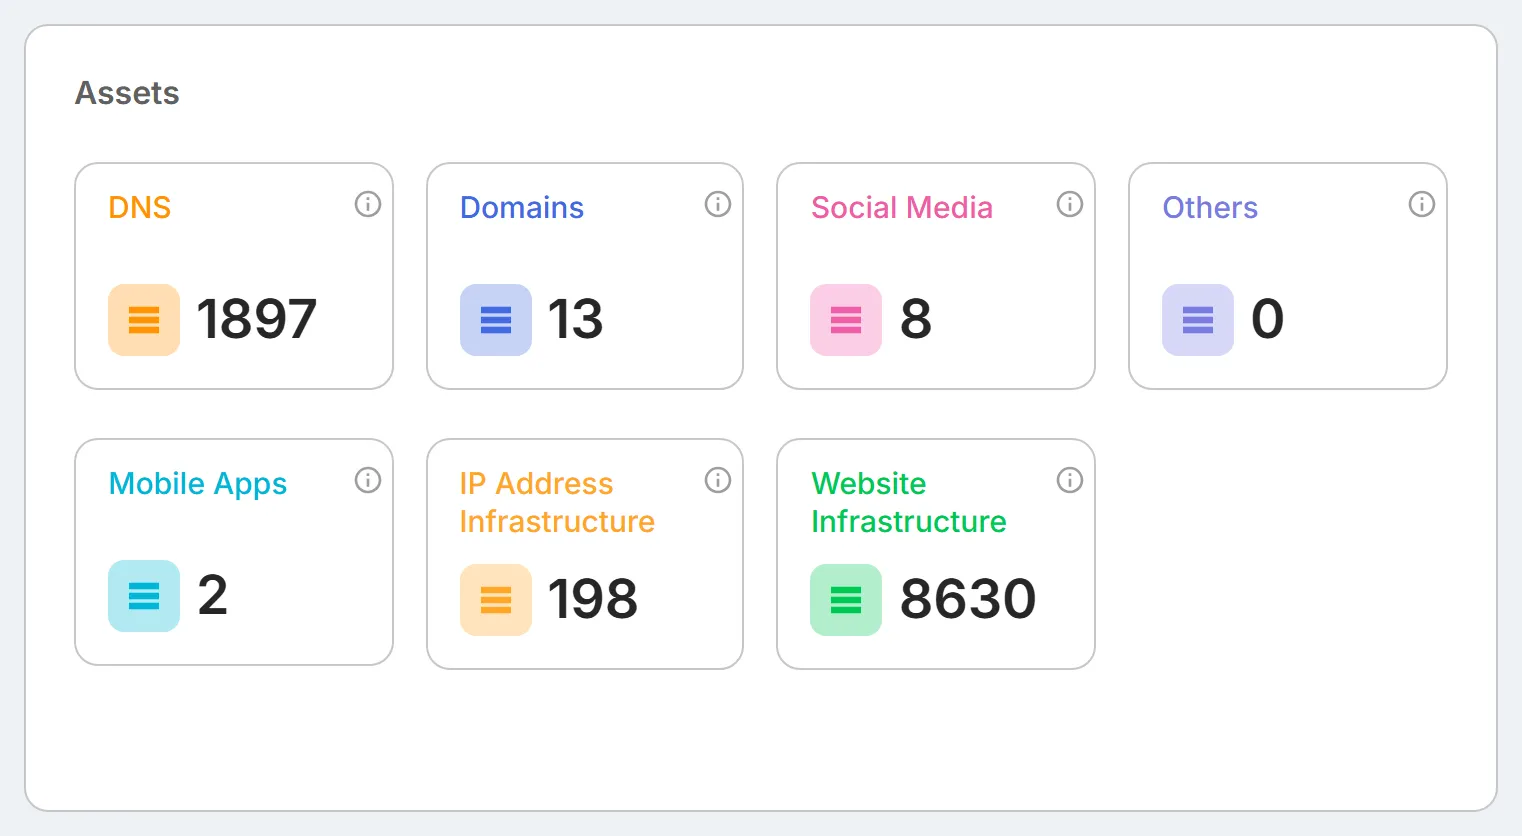
Section titled “Assets”The "Assets" card counts the assets of each type StyxView has found for your organization. Select a tile to open the related page.
| Tile | What it counts |
|---|---|
| "DNS" | DNS records published for your hosts, such as A, MX, TXT, SPF, DMARC, and PTR records. |
| "Domains" | Domains verified as belonging to your organization. |
| "Social Media" | Your organization's official social media accounts that StyxView tracks. |
| "Others" | Monitored items outside the other categories. |
| "Mobile Apps" | Mobile apps published under your organization's name. |
| "IP Address Infrastructure" | The public IP addresses your hosts resolve to. |
| "Website Infrastructure" | Informational websites, input forms, SaaS applications, and TLS/SSL certificates found on your hosts. |
Findings
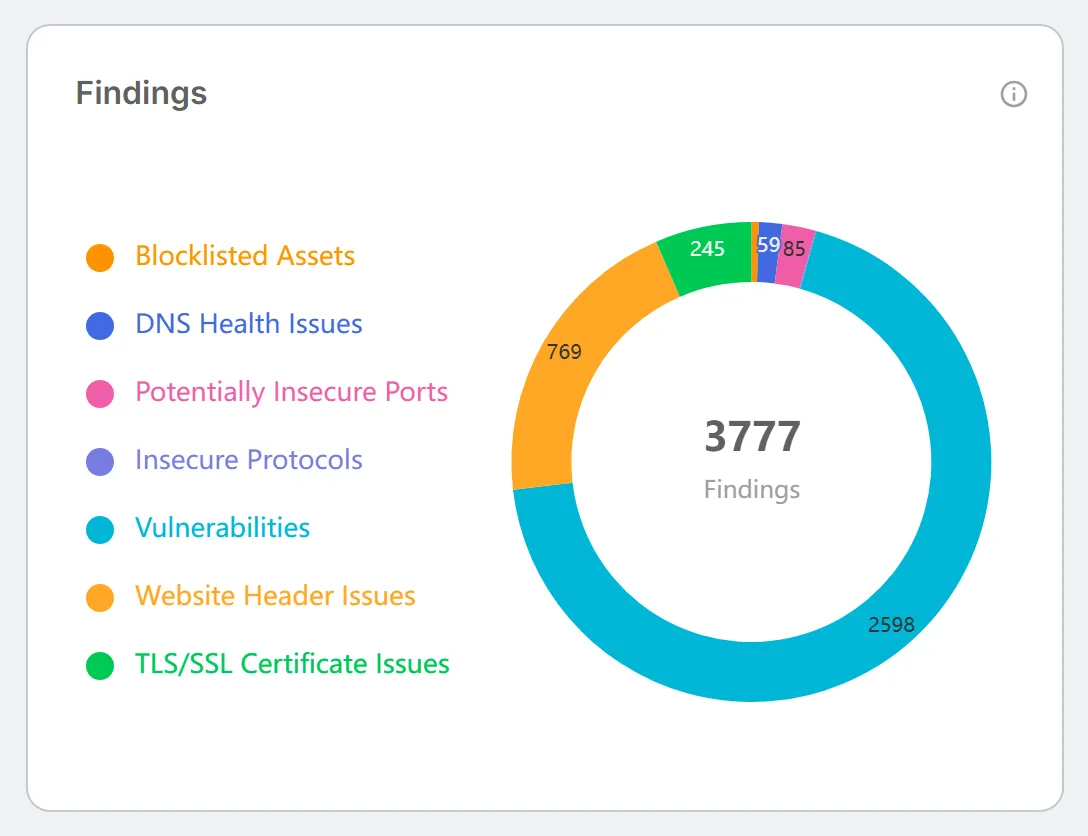
Section titled “Findings”The "Findings" donut chart counts your open attack surface findings by type, with the total in the centre. Findings marked as false positives, and findings with the status Resolved, Closed Without Action, or No Longer Seen, are not counted.
| Finding type | What it covers |
|---|---|
| "Blocklisted Assets" | Your IP addresses and domains listed on public blocklists. |
| "DNS Health Issues" | Misconfigured or missing DNS and email authentication records. |
| "Potentially Insecure Ports" | Open ports commonly associated with risk when reachable from the internet. |
| "Insecure Protocols" | Services that accept outdated or insecure protocols. |
| "Vulnerabilities" | Known vulnerabilities (CVEs) on your hosts. |
| "Website Header Issues" | Missing or misconfigured HTTP security headers. |
| "TLS/SSL Certificate Issues" | Certificate problems such as expiry, a name mismatch, or a weak cipher. |
Brand Protection
Section titled “Brand Protection”This section shows threats to your brand: lookalike domains, impersonating accounts, rogue mobile apps, and unauthorised job postings. Select "View all", or any tile, to open the Brand Protection overview.

| Tile | What it shows |
|---|---|
| "High Severity Findings Requiring Attention" | Findings rated High or Very High that have not been acted on. |
| "Overall Findings Requiring Attention" | Findings at any severity that have not been acted on: no response action raised and not on the watchlist. |
| "Suspicious Artifacts On Watchlist" | Lookalike domains and impersonating accounts on the watchlist. |
| "Response Actions In Progress/Overall" | Response actions in progress, out of all response actions raised. |
Brand Protection Findings Requiring Attention
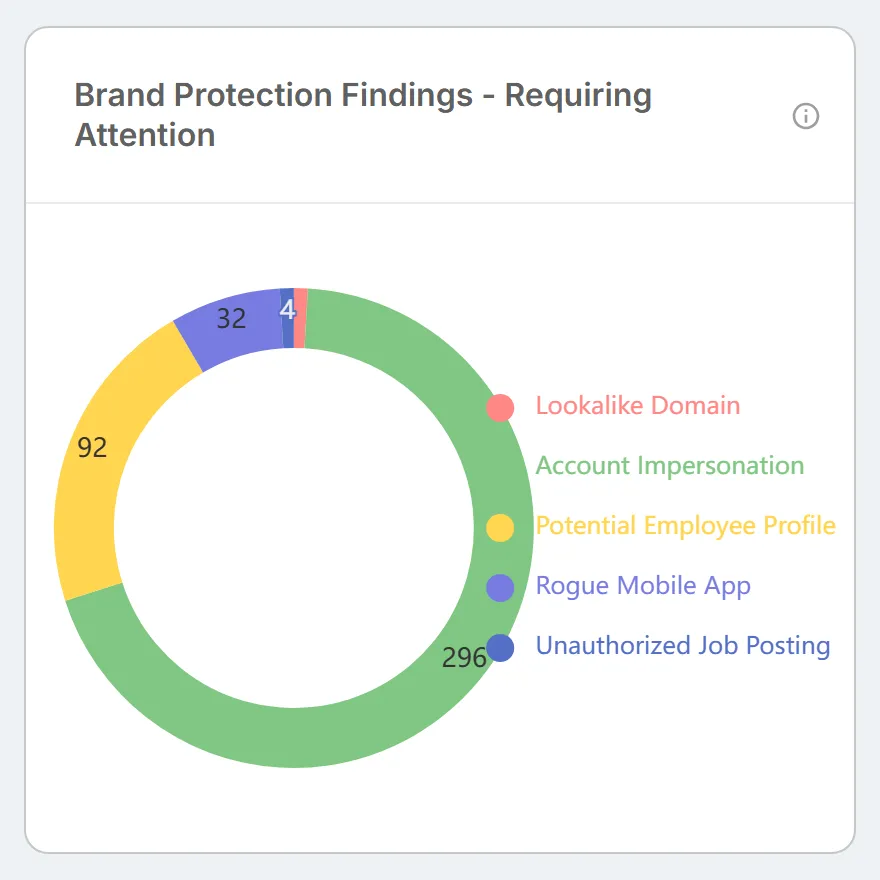
Section titled “Brand Protection Findings Requiring Attention”The "Brand Protection Findings - Requiring Attention" donut chart splits the findings that need action by type: "Lookalike Domain", "Account Impersonation", "Potential Employee Profile", "Rogue Mobile App", and "Unauthorized Job Posting".
Impersonating Social Media Accounts by Severity
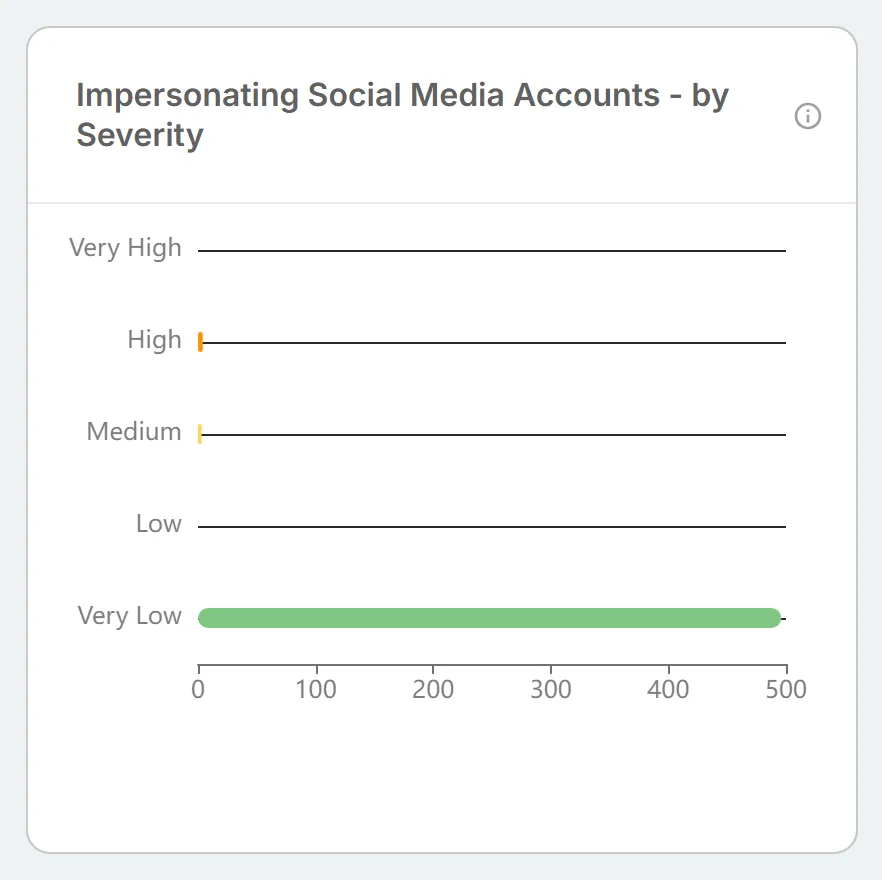
Section titled “Impersonating Social Media Accounts by Severity”The "Impersonating Social Media Accounts - by Severity" bar chart counts impersonating accounts at each severity, from Very High to Very Low. Potential employee profiles and false positives are not included.
Impersonating Social Media Accounts by Platform
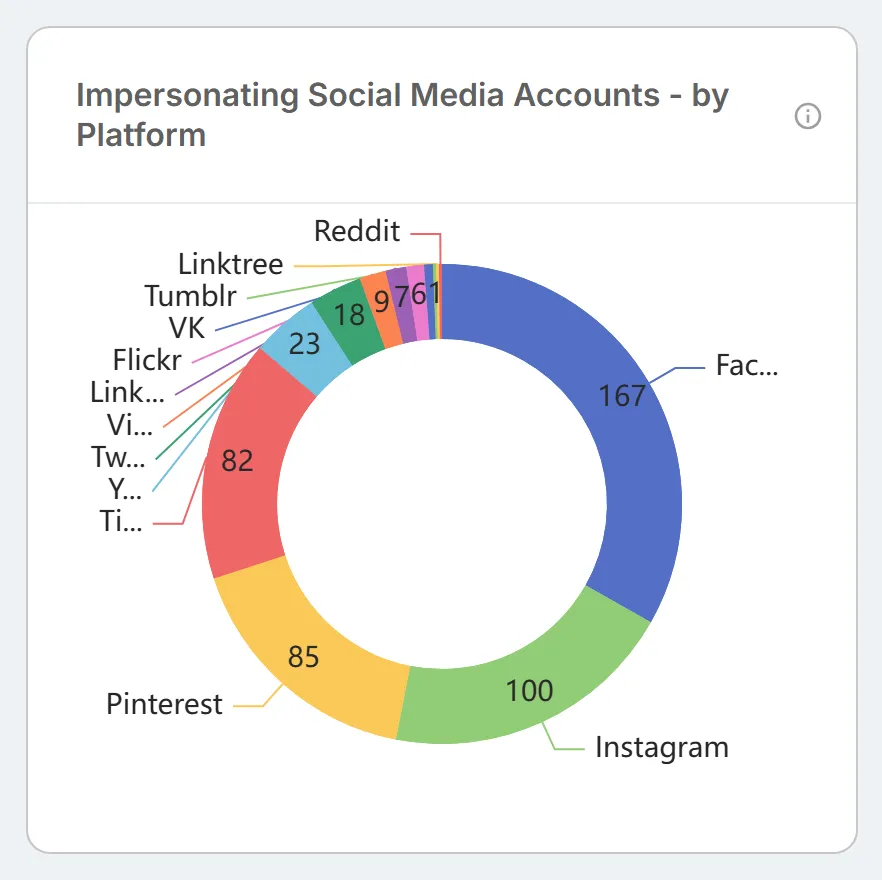
Section titled “Impersonating Social Media Accounts by Platform”The "Impersonating Social Media Accounts - by Platform" donut chart counts the same accounts by the platform they are on, such as Facebook, LinkedIn, or Instagram. Use it to see where impersonation of your brand is concentrated.
Dark Web and Data Leakage
Section titled “Dark Web and Data Leakage”This section counts your data exposed outside your control. Select "View all" to open the Data Leakage & Dark Web Detection overview, or select a tile to open its list.

| Tile | What it counts |
|---|---|
| "User Accounts" | Email addresses on your domains seen in external sources. |
| "Credential Snippets" | Passwords observed alongside other identifiers, such as an email address. |
| "Secret Leaks" | Open findings for exposed secrets, such as API keys, database credentials, service tokens, or private keys. |
| "Exposed Code Repository" | Open findings for public code repositories that contain your proprietary source code. |
Social & News Monitoring
Section titled “Social & News Monitoring”This section shows what is being said about your organization on social media and in the news. Select "View all" to open the Social & News Monitoring overview.
Social Media Posts by Sentiment
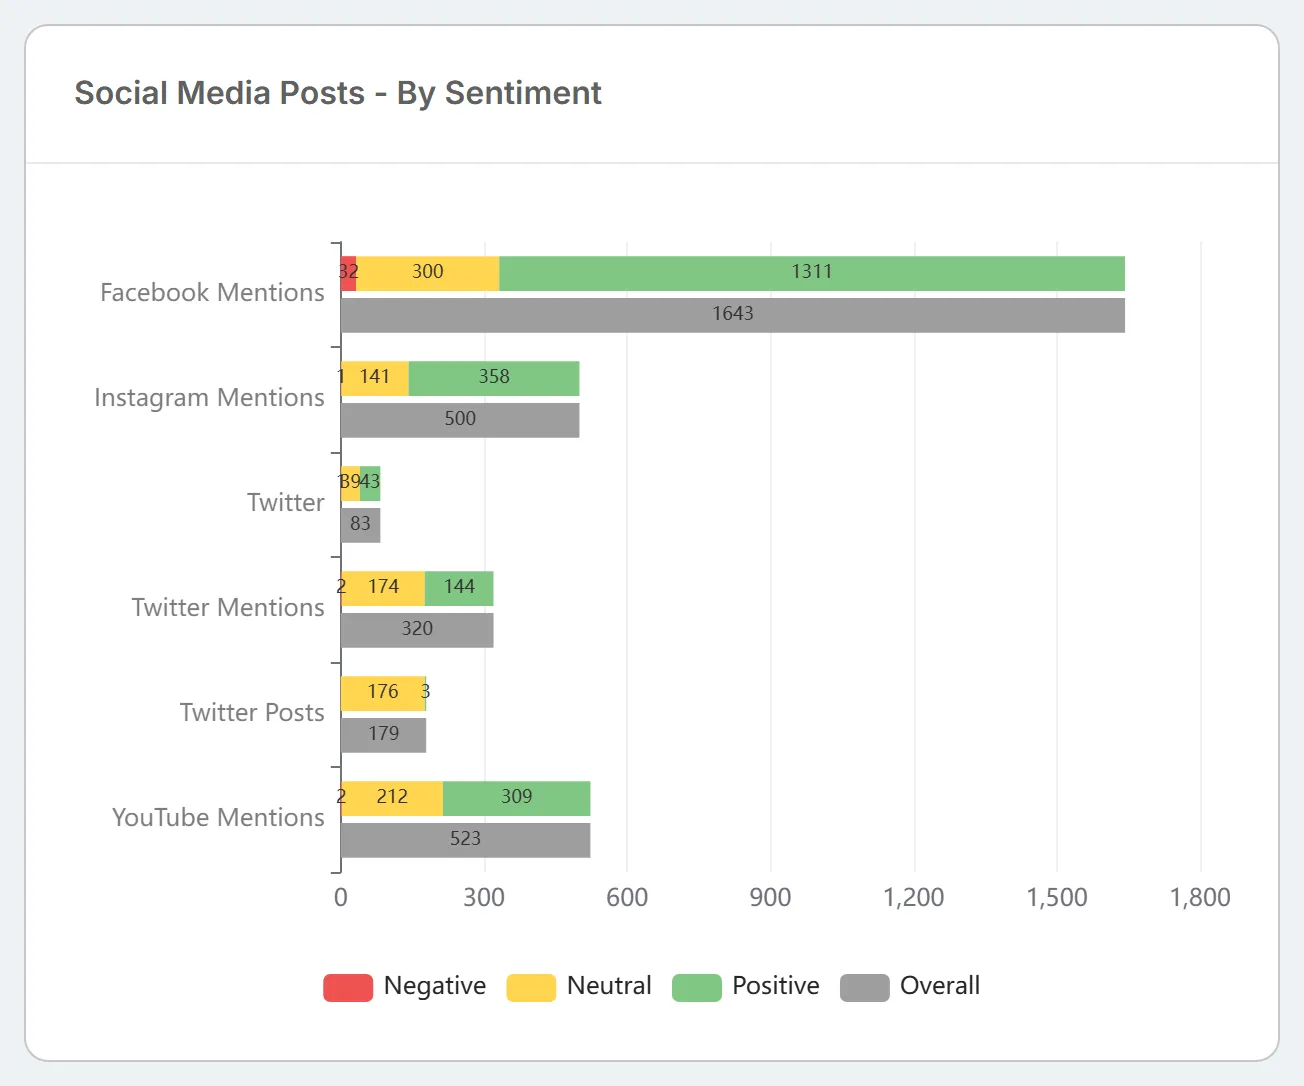
Section titled “Social Media Posts by Sentiment”The "Social Media Posts - By Sentiment" bar chart shows, for each platform, how many posts about your organization are Negative, Neutral, and Positive, and the "Overall" total. False positives are not counted.
News Articles by Sentiment
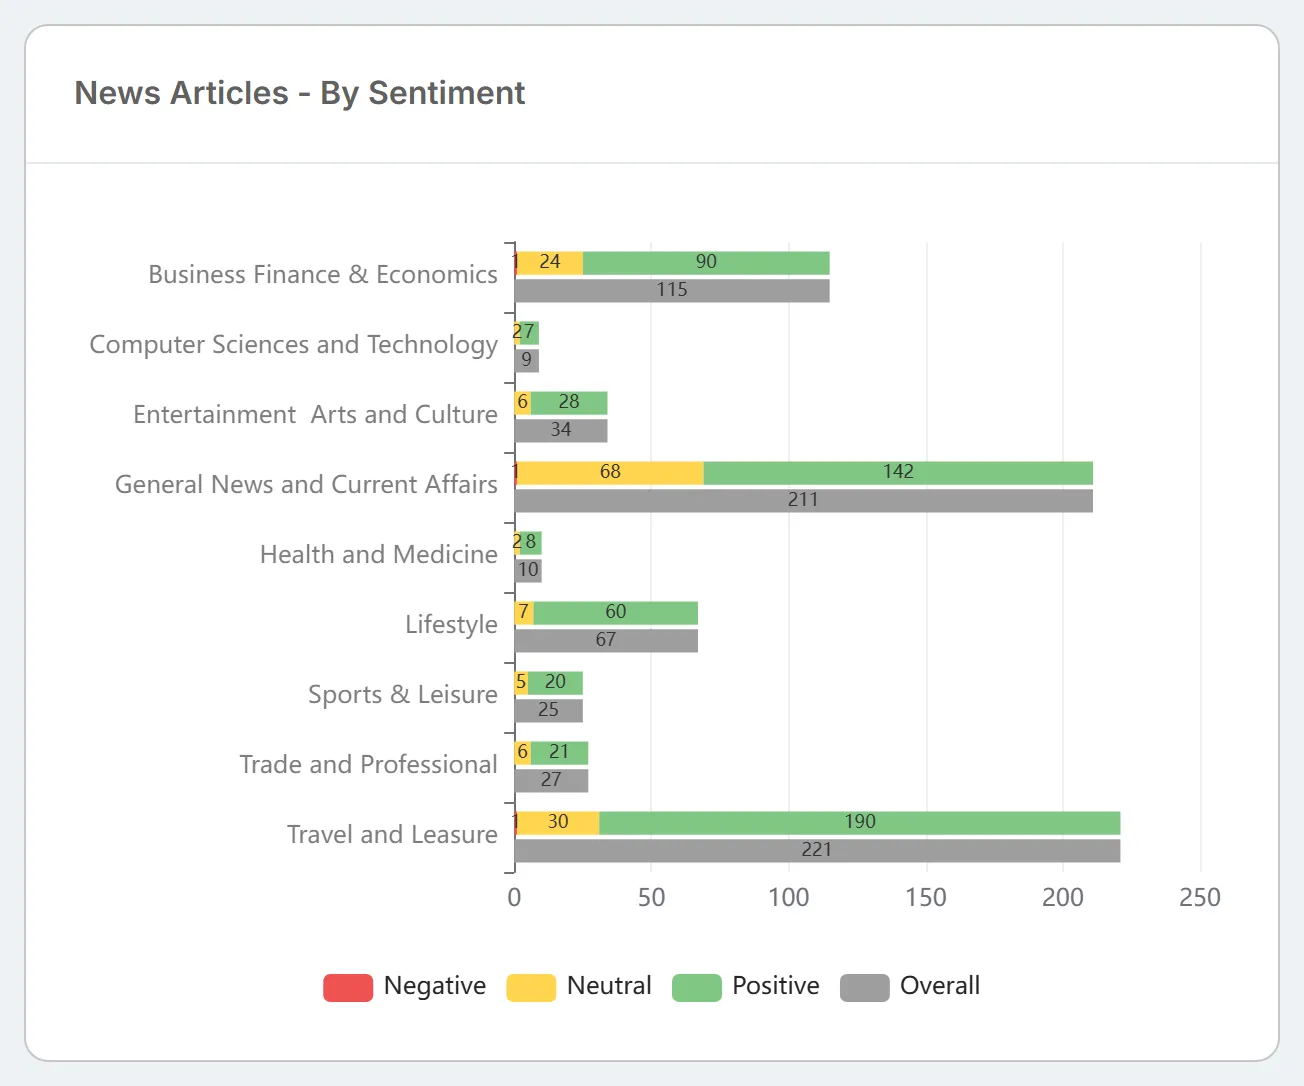
Section titled “News Articles by Sentiment”The "News Articles - By Sentiment" bar chart shows the same split for news articles, grouped by news category, such as "Business Finance & Economics" or "Computer Sciences and Technology". Articles that do not fit a category are grouped as "Unclassified".
Posts Over Time
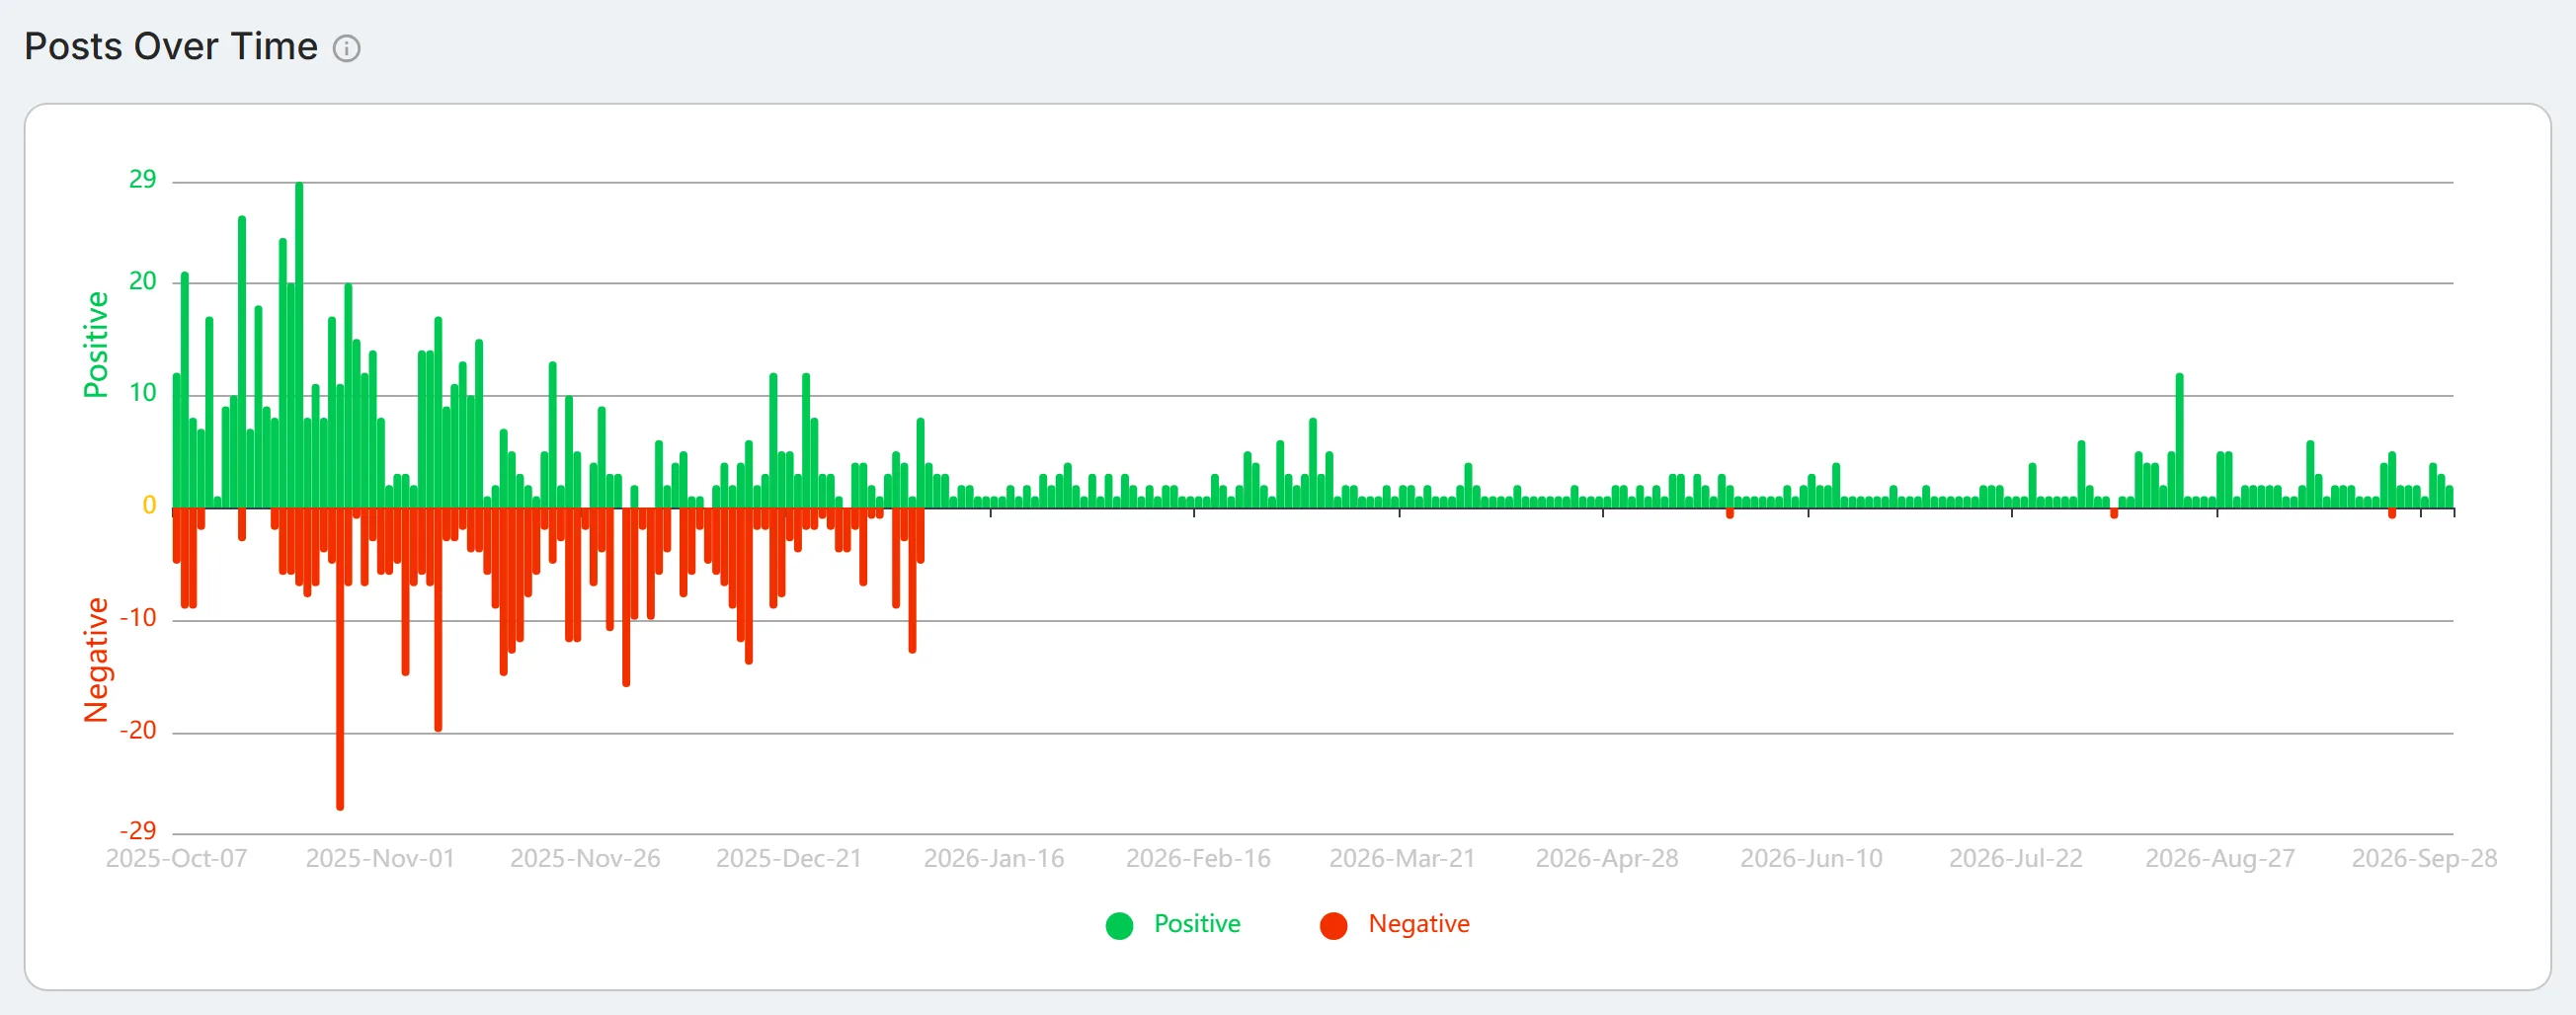
Section titled “Posts Over Time”The "Posts Over Time" chart shows, for each day in the last 12 months, how many posts and articles across your account were positive (above the line) and negative (below the line).
Third Party Risk
Section titled “Third Party Risk”The "Third Party Risk - Automated Risk Exposure & Questionnaire" section summarises the third parties you monitor. It combines what StyxView observes from outside each third party with the questionnaires you send them. The section appears once at least one third party has both a Digital Risk Score and a business criticality.
Third Parties by Risk
Section titled “Third Parties by Risk”This donut chart groups your third parties by the band of their Digital Risk Score. The legend shows each band's share as a percentage.
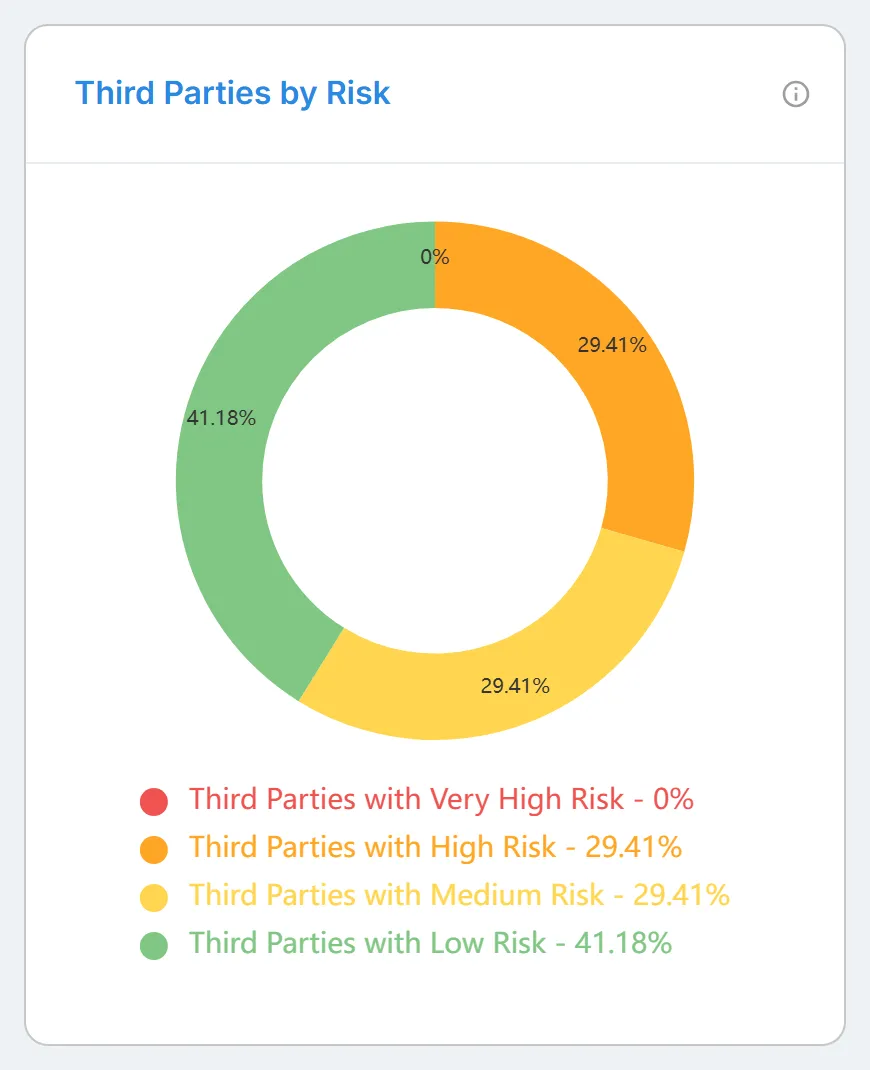
| Band | Digital Risk Score |
|---|---|
| Very High | 750 to 1000 |
| High | 400 to 749 |
| Medium | 200 to 399 |
| Low | 0 to 199 |
Risk Matrix
Section titled “Risk Matrix”This grid plots each third party's "Business Criticality" (rows, from Very High to Very Low) against its "Digital Risk Rating" (columns, from Low to Very High). Each cell shows how many third parties fall into it. Select a cell to open the list of those third parties in the Third Party Overview Dashboard.
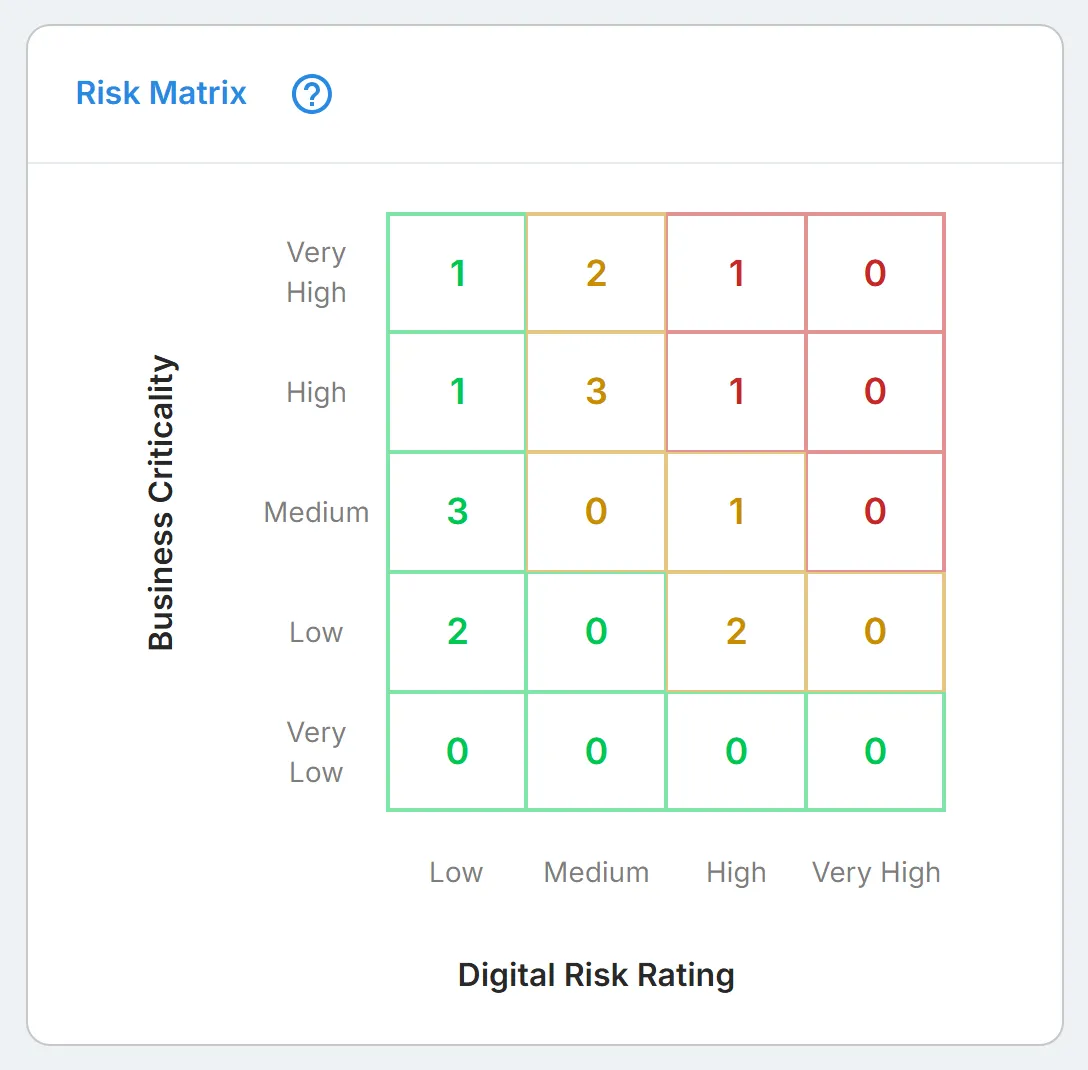
Cells are coloured by priority: green is lower priority, yellow is moderate, and red is the highest, where a business-critical third party also has a High or Very High rating.
Automated Risk Exposure
Section titled “Automated Risk Exposure”This card shows the results of the external scanning StyxView runs on your third parties.
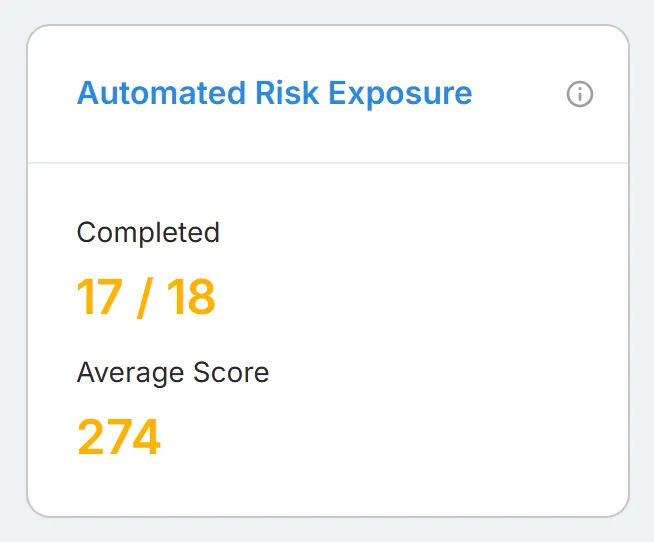
| Metric | What it shows |
|---|---|
| "Completed" | Third parties that have a Digital Risk Score, out of all the third parties you monitor. |
| "Average Score" | The average Digital Risk Score of those third parties, from 0 to 1000. |
Questionnaire
Section titled “Questionnaire”This card shows the status of the security questionnaires you have sent to third parties.
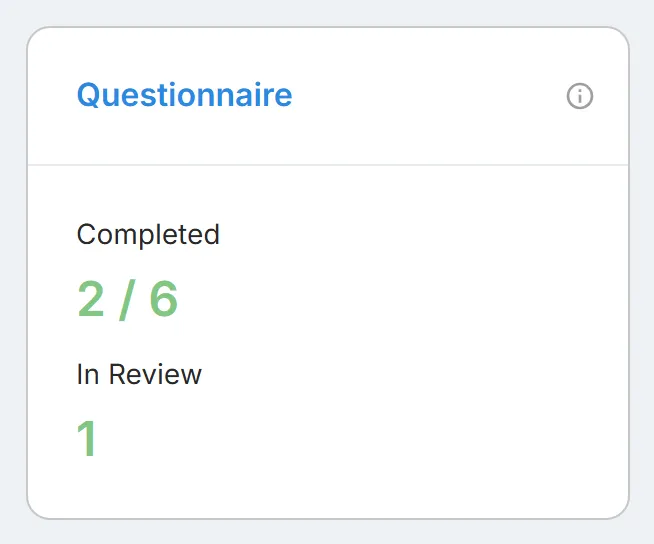
| Metric | What it shows |
|---|---|
| "Completed" | Completed questionnaires, out of all the questionnaires you have sent. |
| "In Review" | Questionnaires that are being reviewed. |
Executive Protection
Section titled “Executive Protection”This section shows one card for each executive you monitor. Select "View all" to open the Executive Protection summary, or select an executive's initials to open their overview.
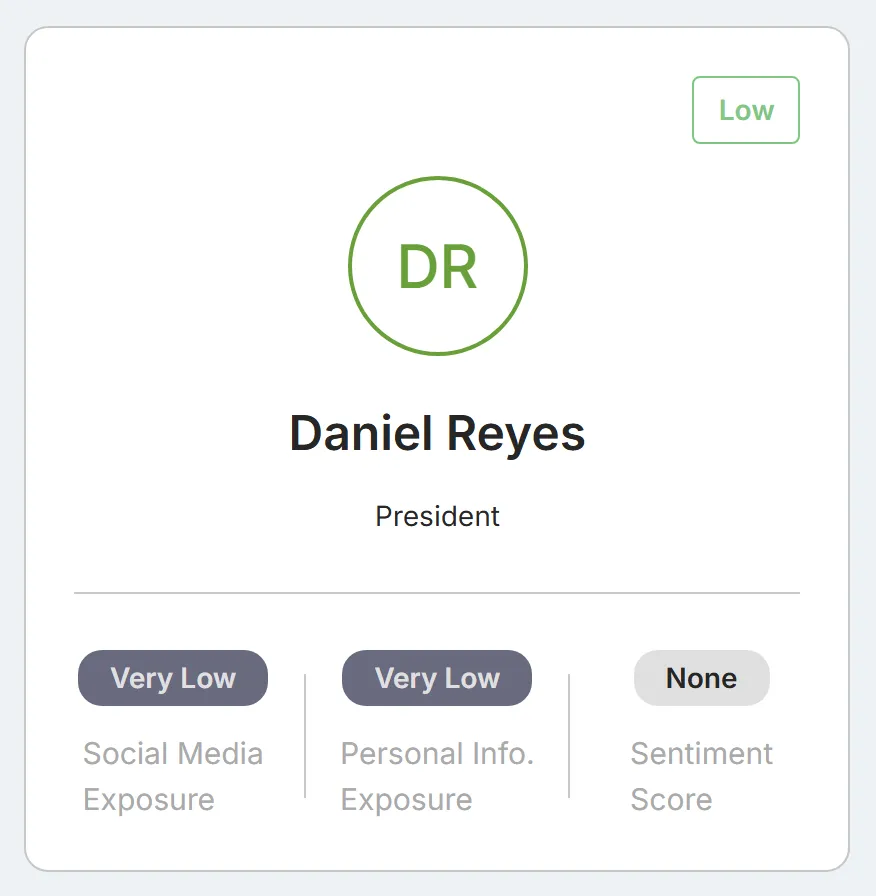
Each card shows:
- The executive's name and job title.
- Their overall risk rating, in the top right corner.
- "Social Media Exposure": how much of their information is exposed on social media.
- "Personal Info. Exposure": how much of their personal information is exposed, for example in data breaches.
- "Sentiment Score": whether coverage of them is positive, neutral, or negative.