

Disinformation Monitoring
Disinformation Monitoring shows what is being said on social media about your organisation, and how it is being pushed: which narratives and hashtags are active, how fast content spreads, and how much of it comes from automated accounts (bots) or coordinated groups. Use it to spot a campaign early and to find the posts and accounts behind it.
Disinformation Monitoring is an add-on module. It appears in the menu only on accounts where it is enabled. To add it to your account, ask your Styx Intelligence account team.
Where to find it
Section titled “Where to find it”Select "Company Protection" > "Social & News Monitoring" > "Disinformation Monitoring".
For executives, see In Executive Protection.
Filters
Section titled “Filters”Three lists at the top right set what the page shows:
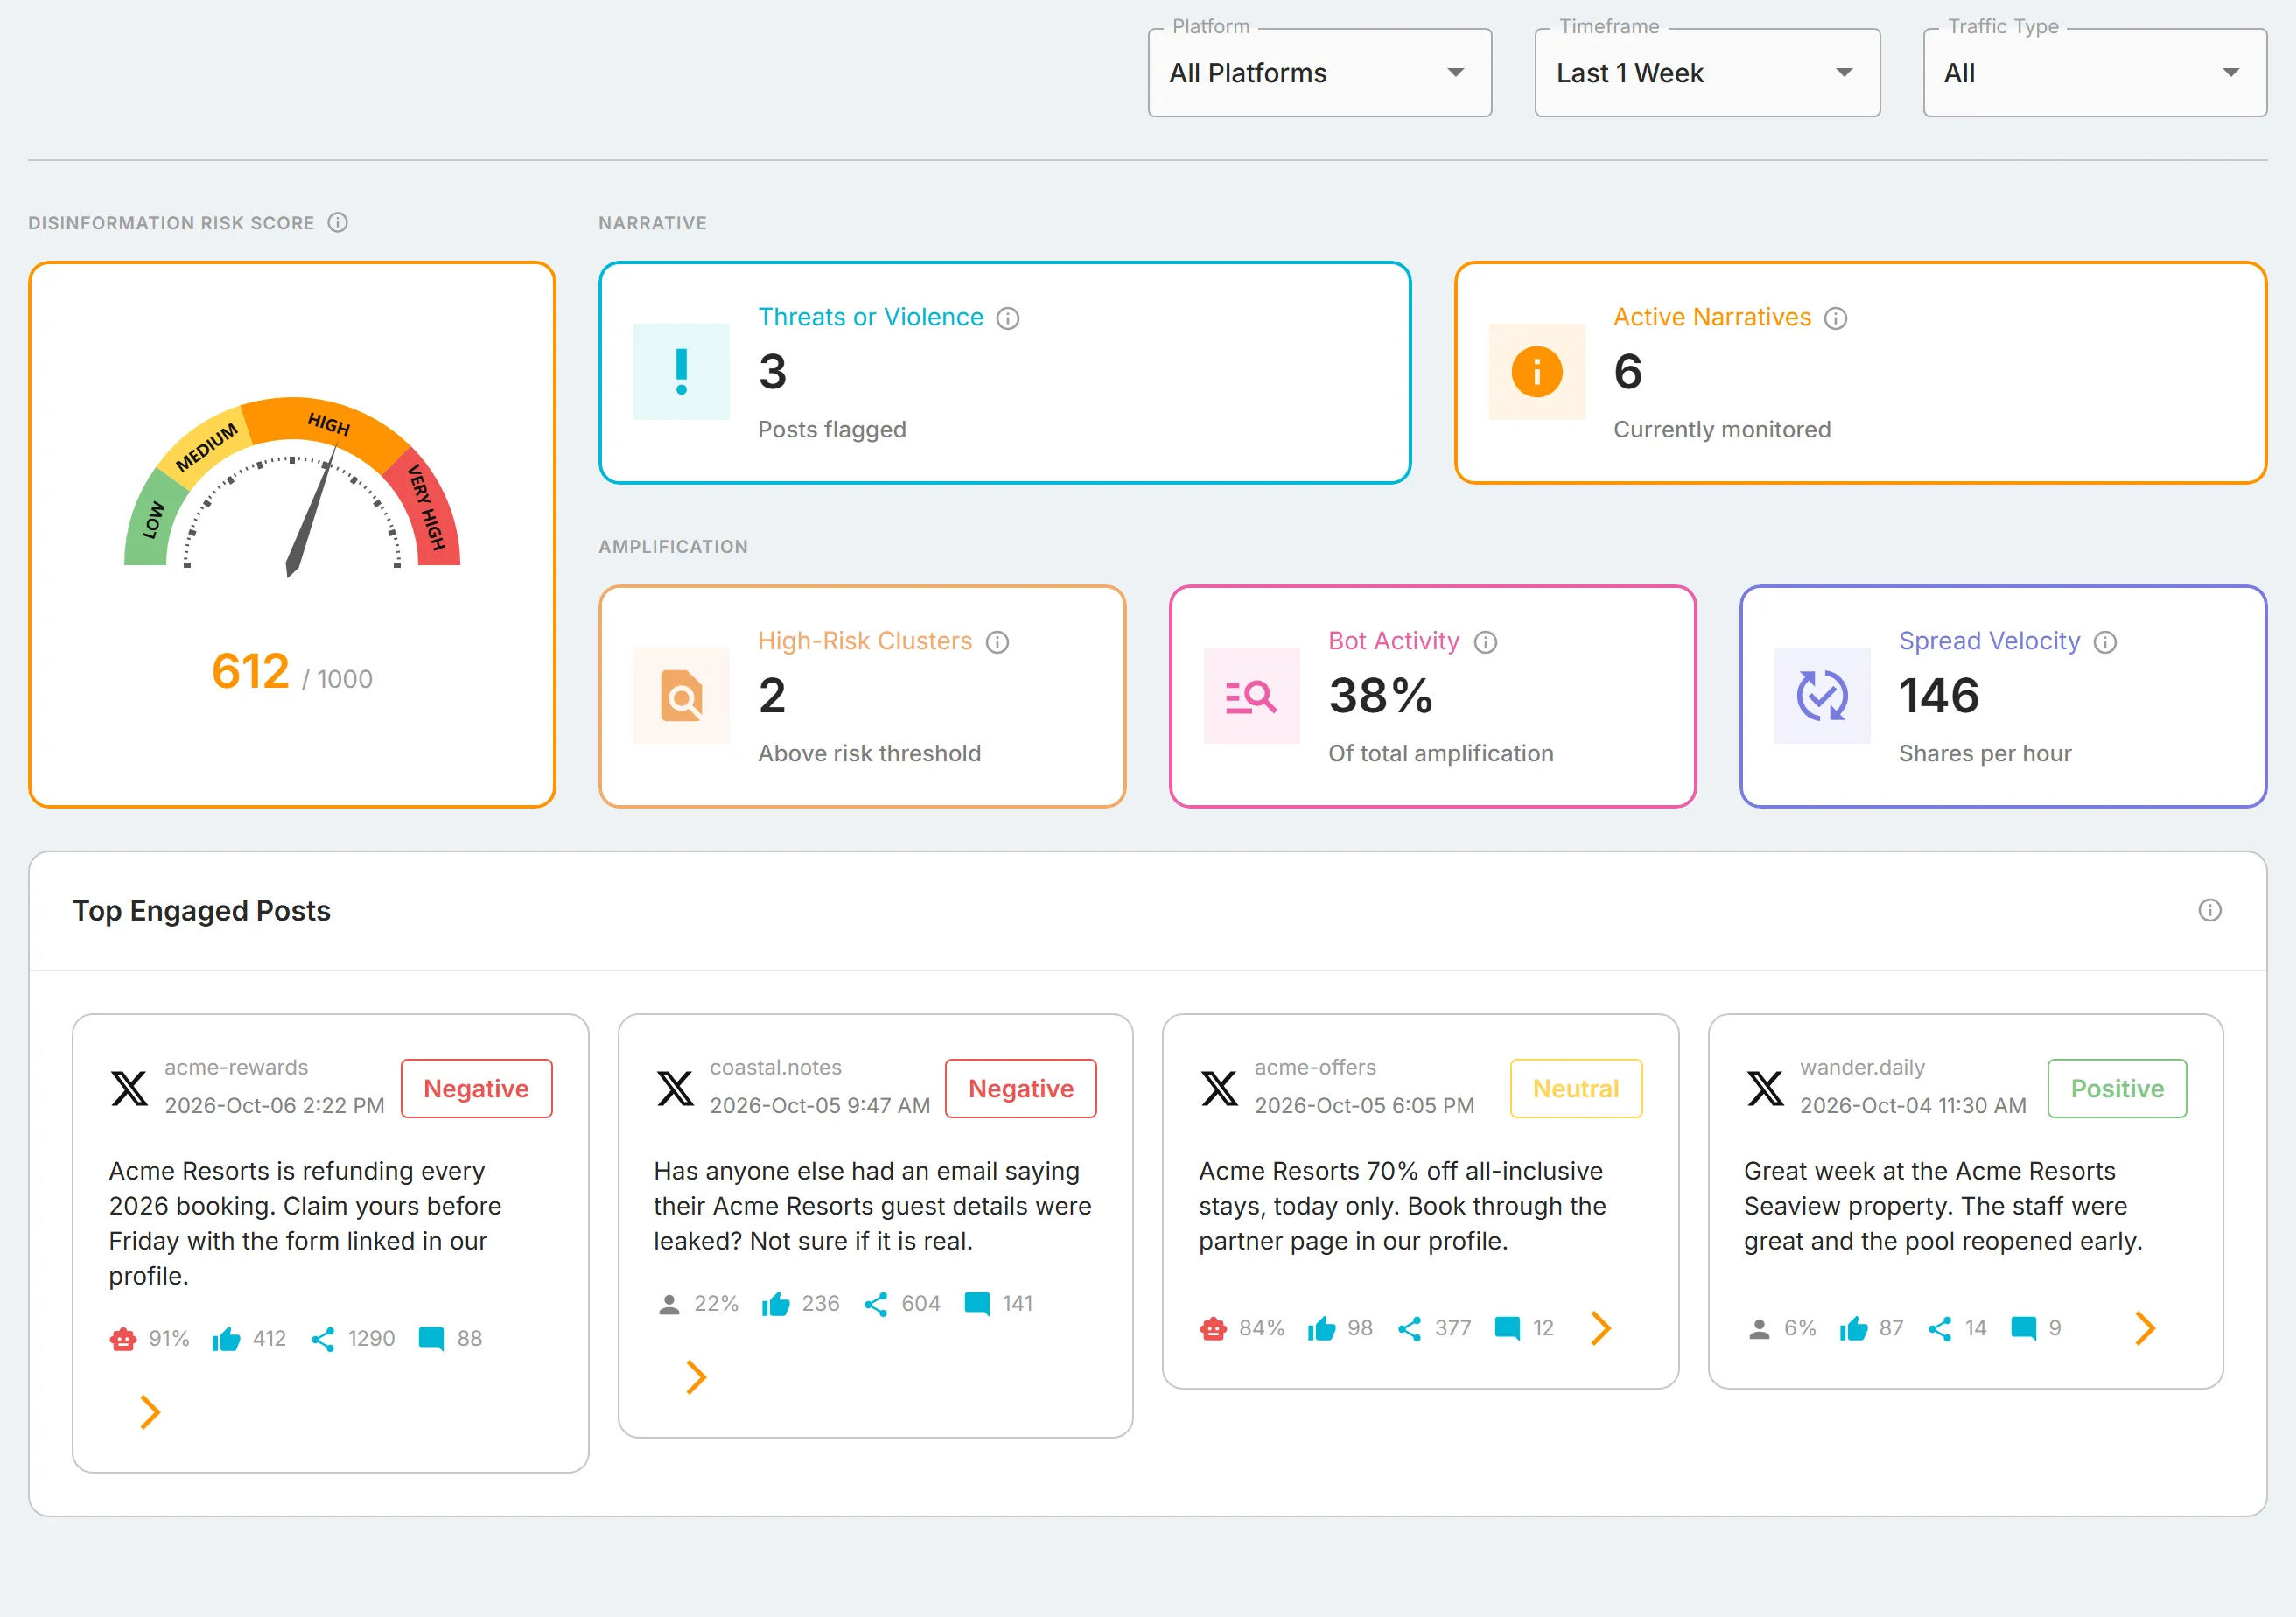
- "Platform": the social media platform. "All Platforms" is the only option.
- "Timeframe": "Last 4 hr", "Last 12 hr", "Last 24 hr", "Last 48 hr", "Last 1 Week", "Last 2 Weeks", "Last 3 Weeks", or "Last 1 Month". The page opens on "Last 1 Week".
- "Traffic Type": "Human", "Bot", or "All". The page opens on "All".
A list you open from the page, such as the posts behind a narrative, covers the "Timeframe" you selected.
Disinformation Risk Score
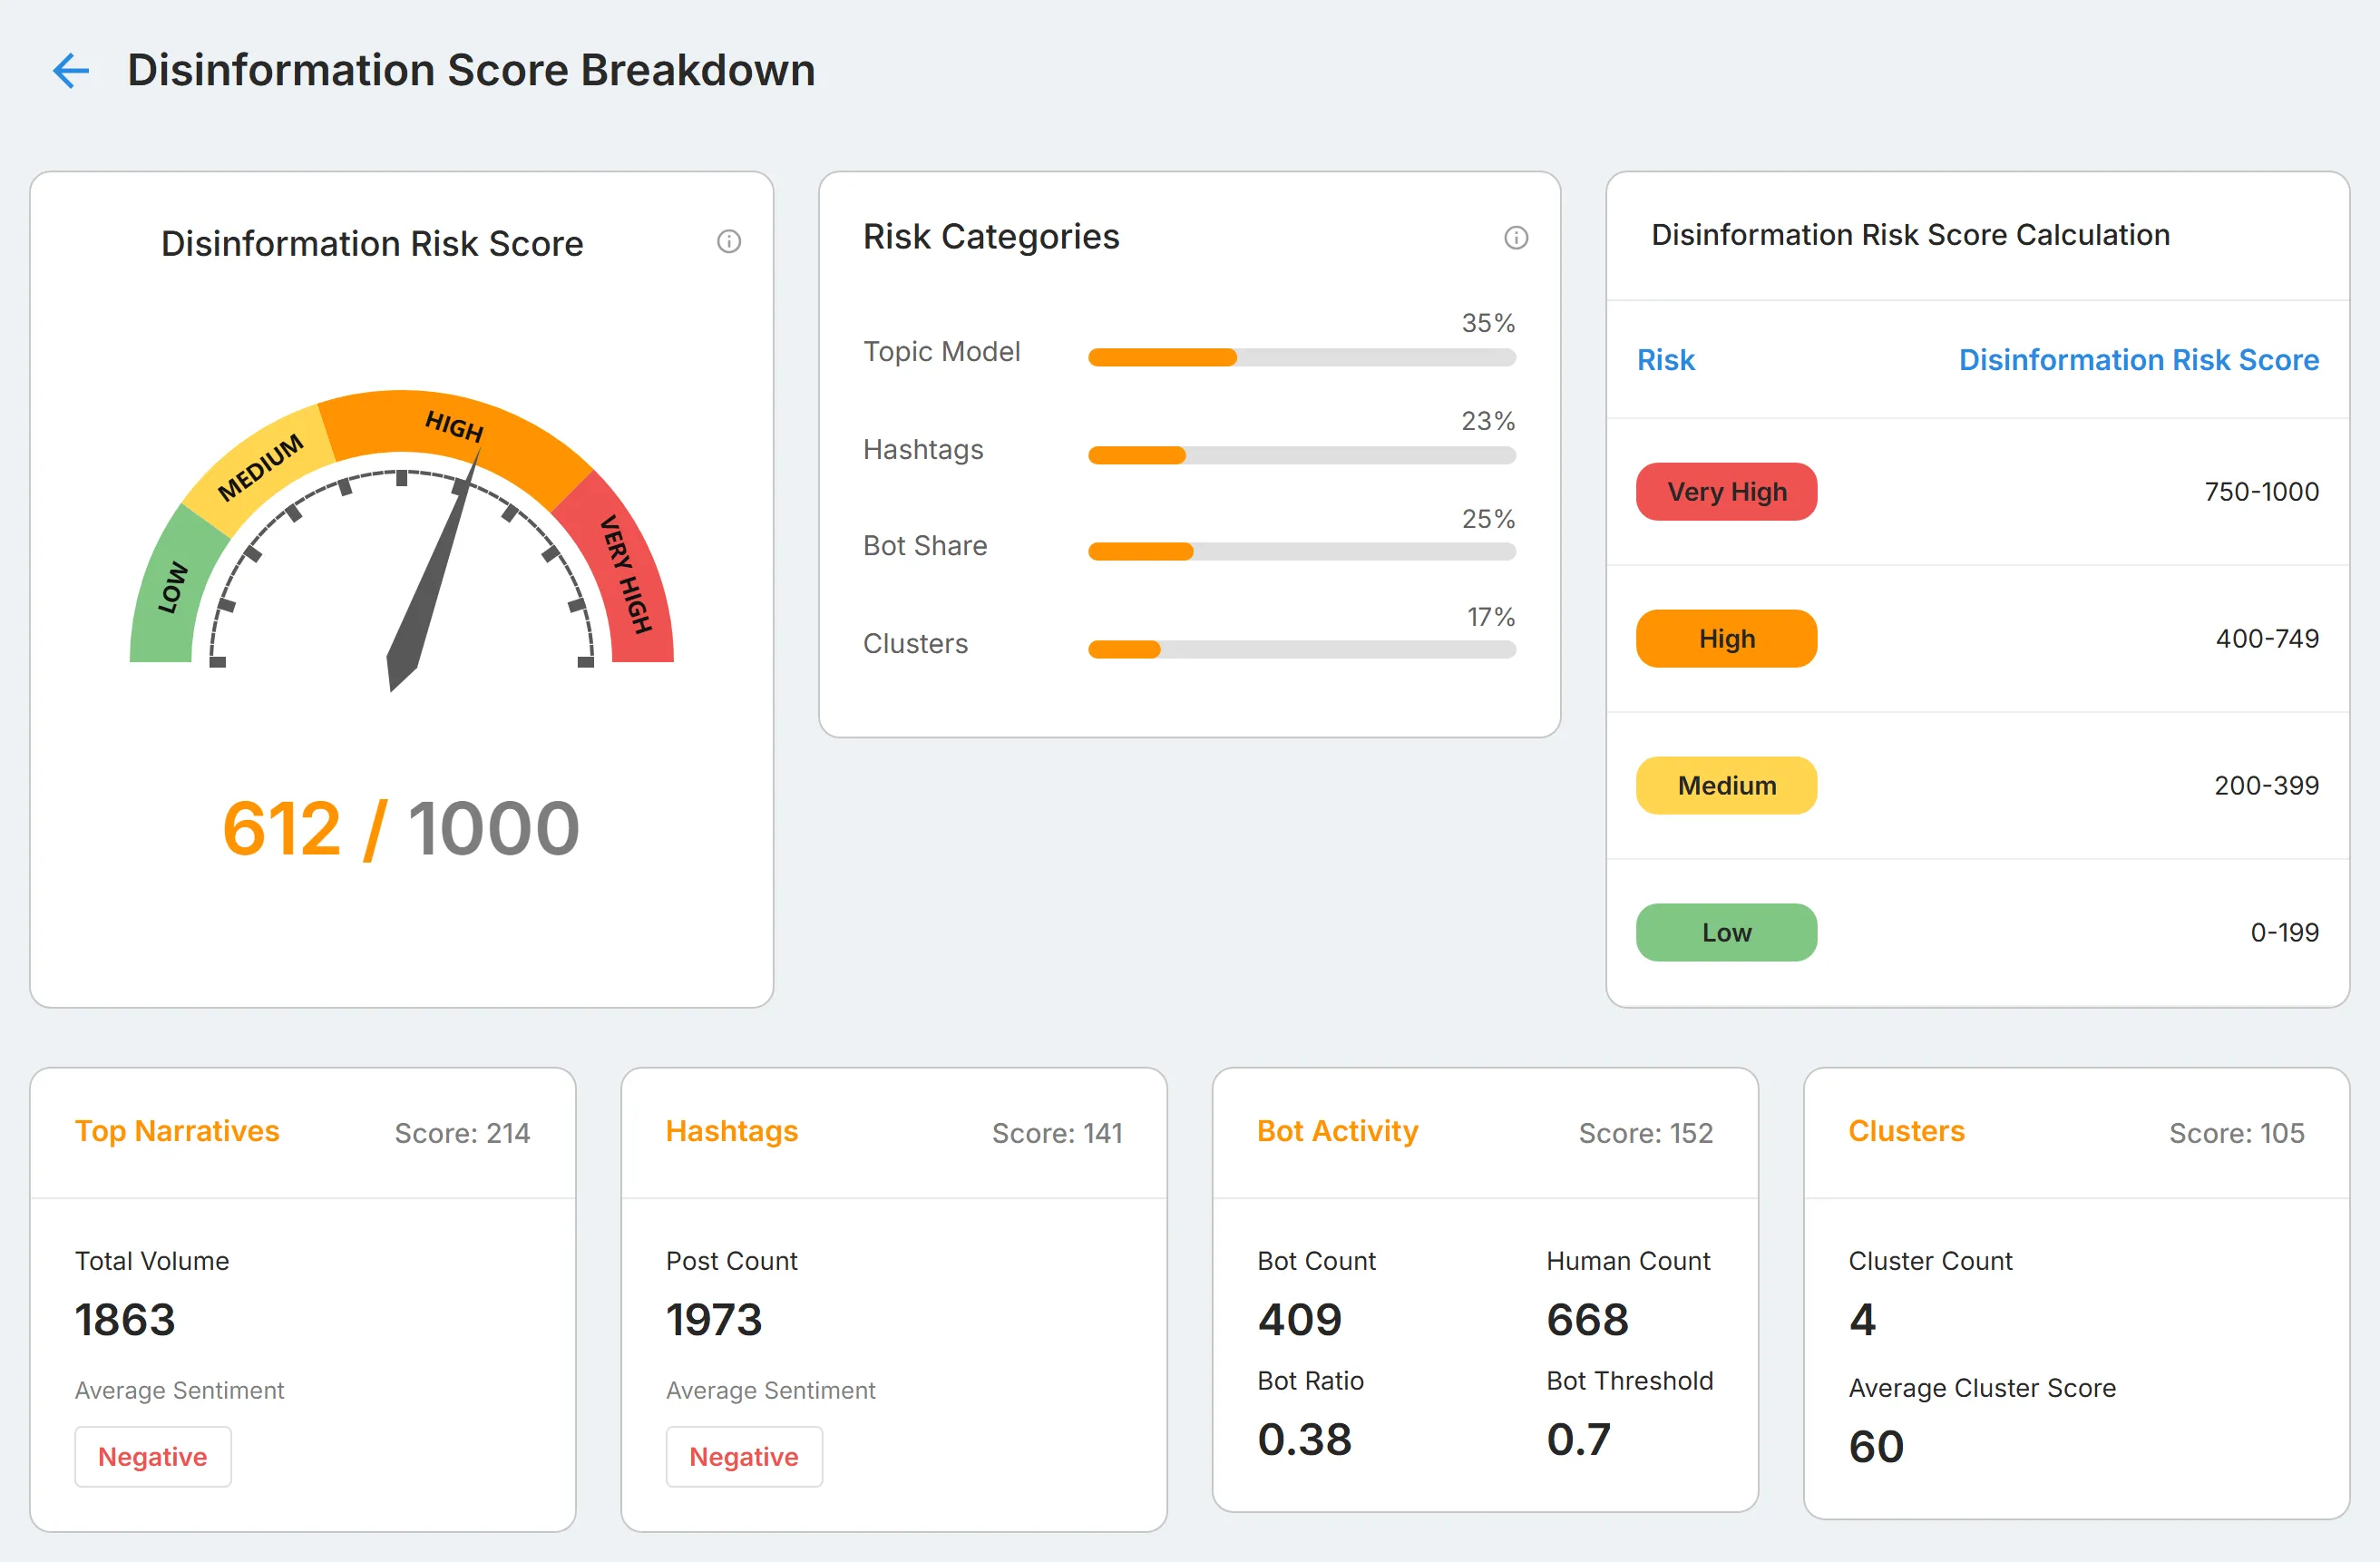
Section titled “Disinformation Risk Score”The "Disinformation Risk Score" card is a single score from 0 to 1000 for how much coordinated, inauthentic, or hostile activity surrounds the target in the selected period. It combines four weighted inputs: narrative sentiment and volume, hashtag activity, the share of automated accounts, and coordinated clustering. A high score usually means several of these are raised at once.
The card's border colour changes with the score, in four bands: 0 to 250, 251 to 500, 501 to 750, and above 750.
Select the card to open "Disinformation Score Breakdown":
- "Risk Categories": how much of the score comes from each input, as "Topic Model", "Hashtags", "Bot Share", and "Clusters".
- "Top Narratives": "Total Volume" and "Average Sentiment".
- "Hashtags": "Post Count" and "Average Sentiment".
- "Bot Activity": "Bot Count", "Bot Ratio", "Human Count", and "Bot Threshold".
- "Clusters": "Cluster Count" and "Average Cluster Score".
Each card shows its own "Score", the points it adds to the total.
Narrative and Amplification
Section titled “Narrative and Amplification”Next to the score, five tiles answer two questions. "Narrative" is what is being said. "Amplification" is how hard and how fast it is being pushed.
| Tile | What it shows |
|---|---|
| Threats or Violence | Posts that AI analysis flagged as containing threats, incitement, or violent language. Select it to open "Threats and Violence", the list of those posts. |
| Active Narratives | The number of distinct storylines in the period, grouped by theme rather than by post. |
| High-Risk Clusters | Clusters of near-identical posts that scored above the risk threshold. Select it to open the full list of clusters. |
| Bot Activity | The share of the conversation posted by accounts classified as automated. It is always measured across all traffic, whatever "Traffic Type" you choose. |
| Spread Velocity | How many times per hour content is reshared, averaged across the period. |
A zero means nothing was found in the selected period. It does not mean monitoring has stopped.
Top Engaged Posts
Section titled “Top Engaged Posts”"Top Engaged Posts" shows the posts with the most engagement in the period, ranked by likes, replies, and reshares combined. Each card shows the author, when it was posted, its sentiment, the text, the author's bot score, and its likes, reshares, and replies.
The bot score is the likelihood that the author is an automated account. Above the threshold, StyxView treats the account as automated.
Select the arrow on a card to open the post. See The post page.
Inauthentic Amplification - Content Clustering
Section titled “Inauthentic Amplification - Content Clustering”This section groups posts that push near-identical messaging in the same window. Each cluster card shows its topic, "Sentiment", "Bot/Human Ratio", and "Cluster Score". The cluster score combines how many posts the cluster holds, how similar their wording is, and how much automation is involved.
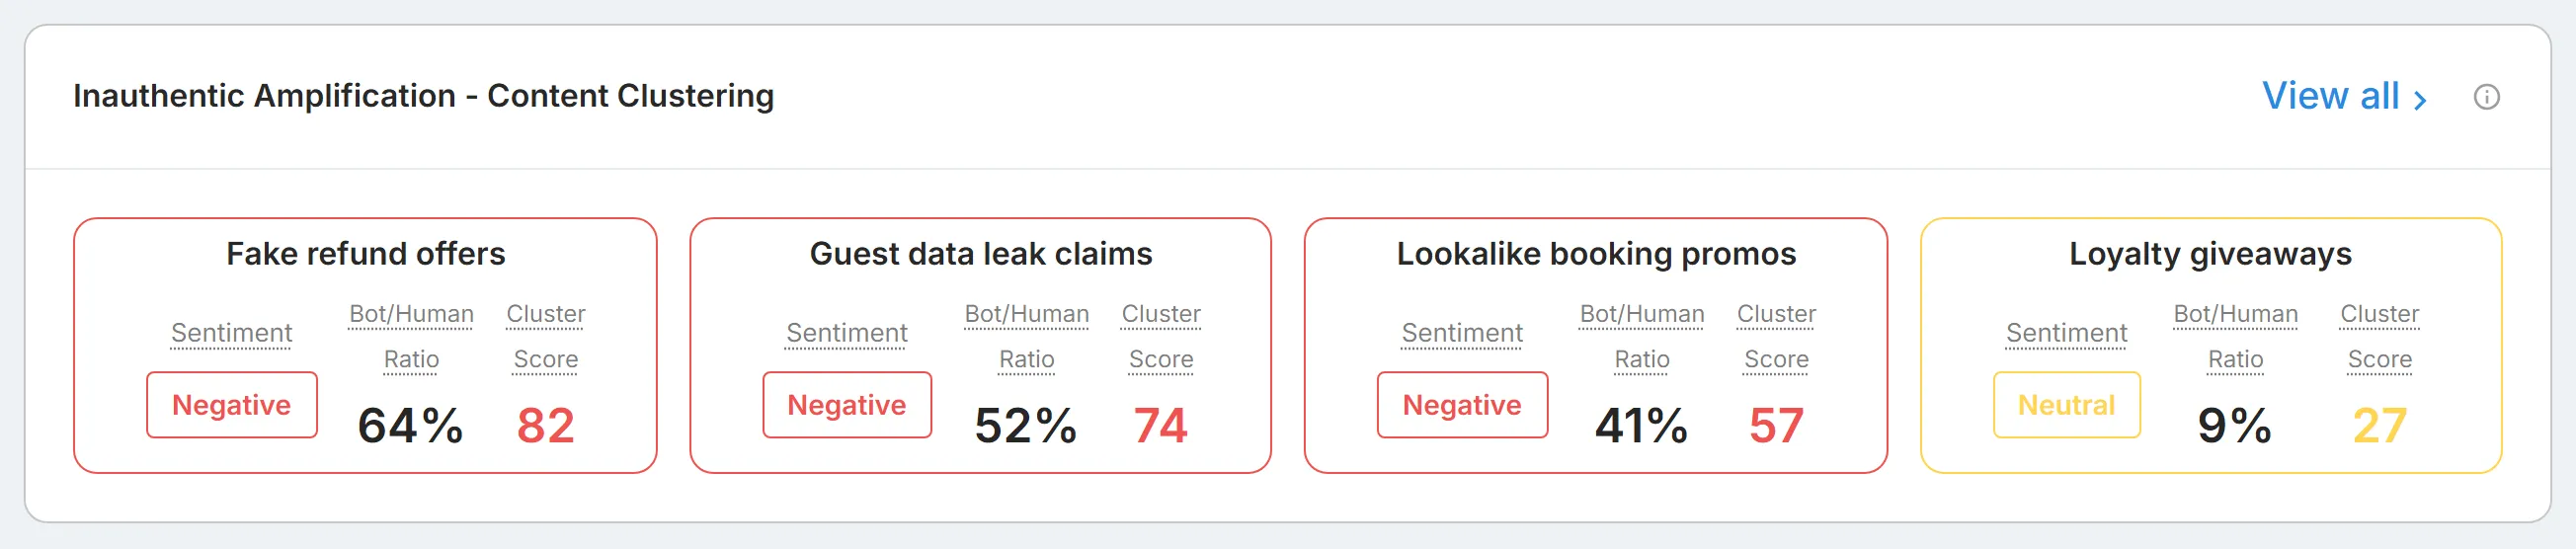
A high cluster score with a high bot to human ratio points to coordinated amplification. The same message from many human accounts is usually organic.
Select a card to open the cluster, with its posts listed by "Description", "Bot", "User Name", "Bot Score", and "Sentiment". Select "View all" to list every cluster, with its "Topic", "Score", "Bot Score", "Sentiment", "Size", "Bot Human Ratio", and "Time Stamp".
Top Active Narratives, Hashtags, and Authors
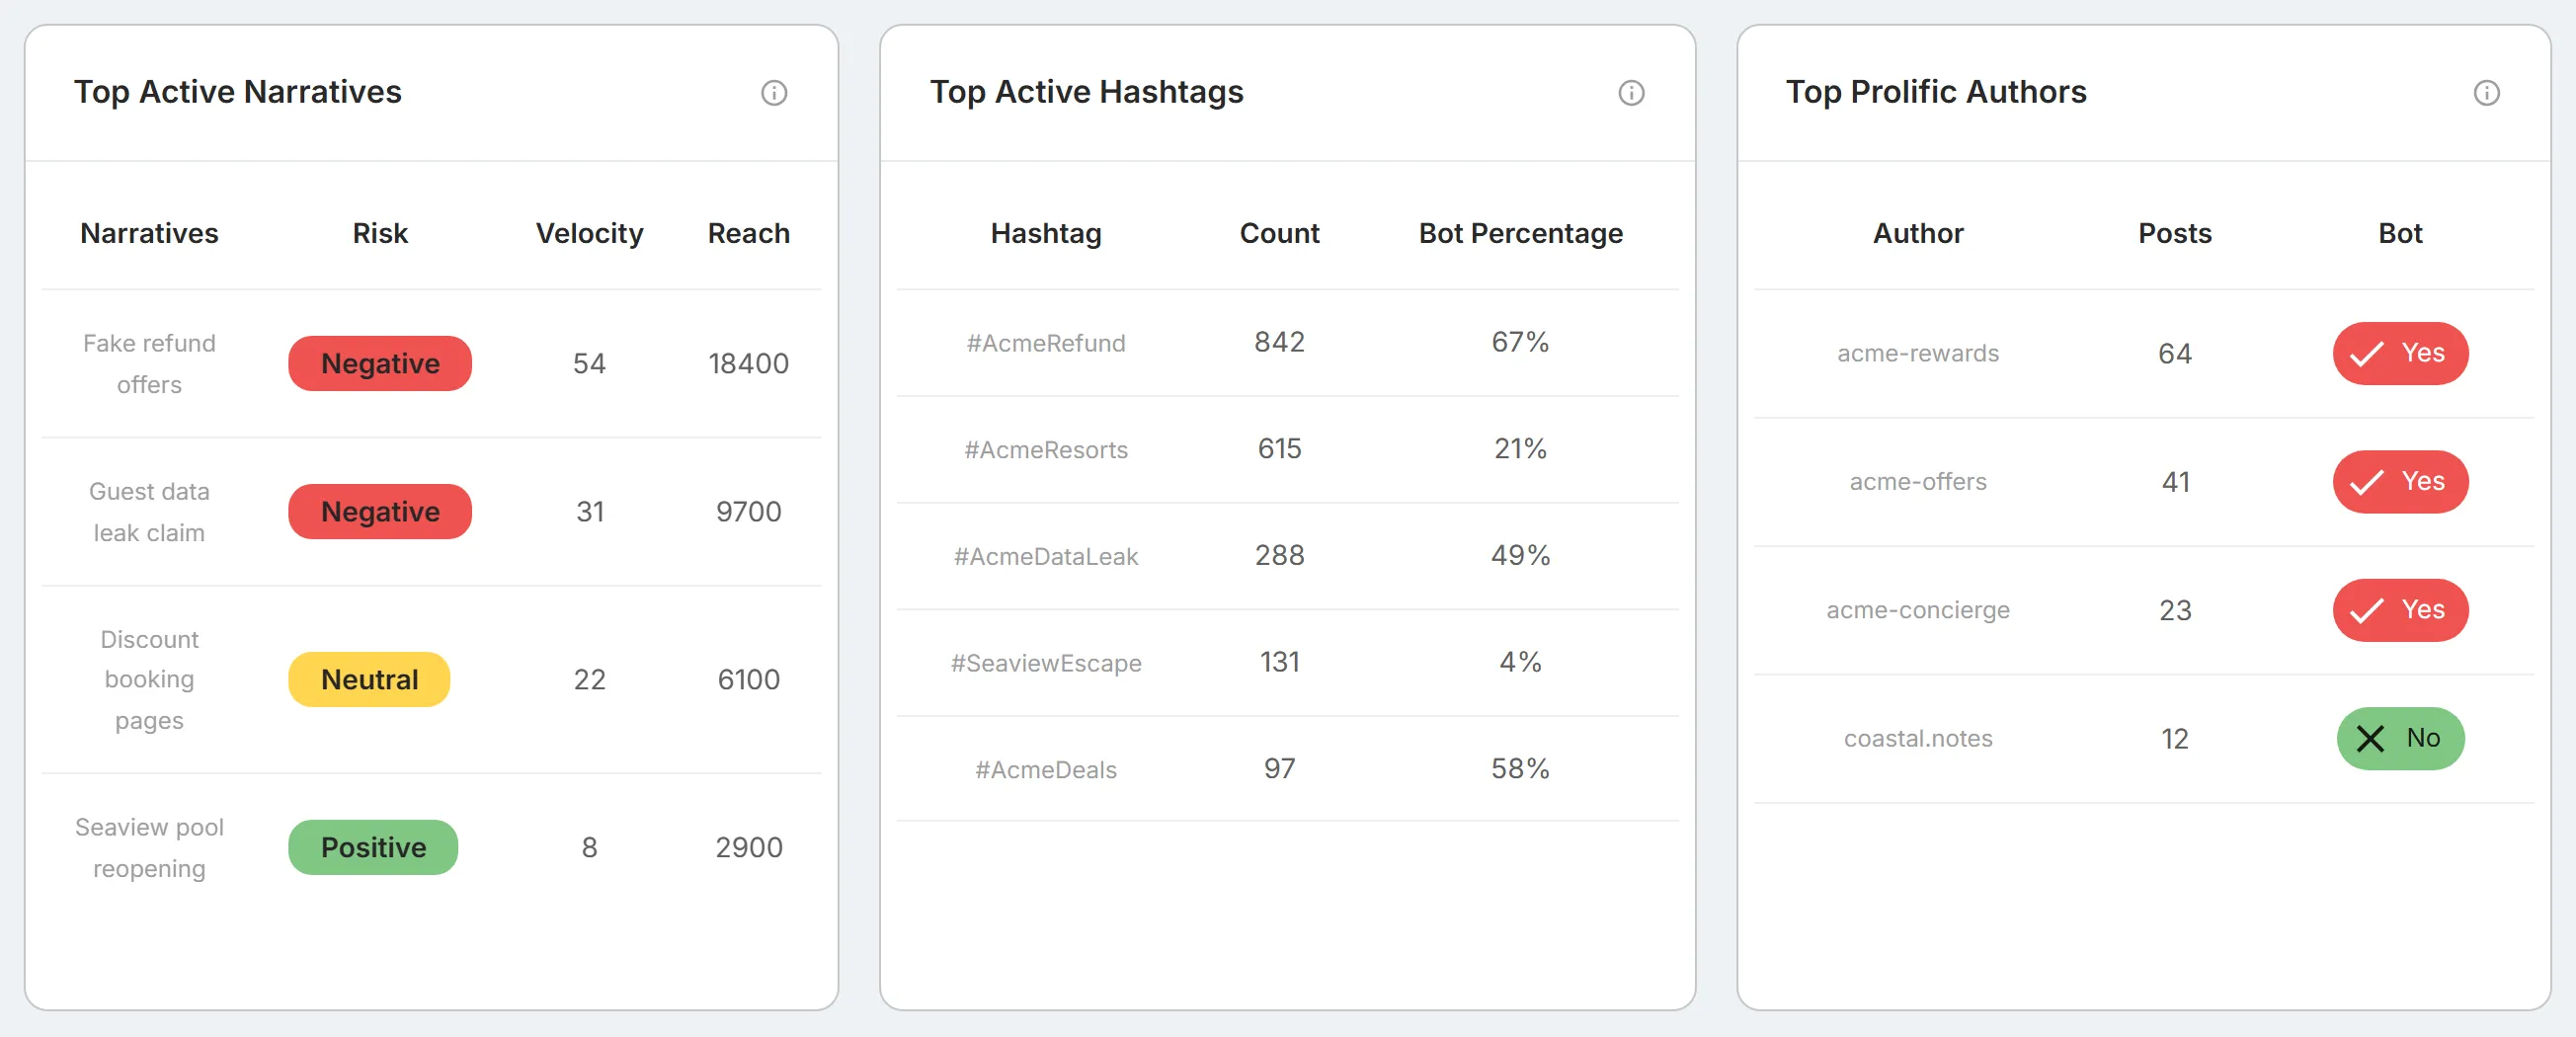
Section titled “Top Active Narratives, Hashtags, and Authors”Three tables rank what drives the conversation. A table that has no data is not shown.
| Table | Columns | What it shows |
|---|---|---|
| Top Active Narratives | "Narratives", "Risk", "Velocity", "Reach" | Each storyline with its sentiment, posts per hour, and the combined audience of the accounts carrying it. |
| Top Active Hashtags | "Hashtag", "Count", "Bot Percentage" | The most used hashtags and the share of each posted by automated accounts. A high bot percentage usually marks a campaign tag. |
| Top Prolific Authors | "Author", "Posts", "Bot" | The accounts posting most often, and whether each is classified as automated. |
Select a row to list its posts. A narrative opens "Top Active Narrative", a hashtag opens "Top Active HashTags", and an author opens "User".
A negative narrative with rising velocity is usually the one to act on first. A few accounts producing a large share of the posts is a common sign of a coordinated effort.
Charts
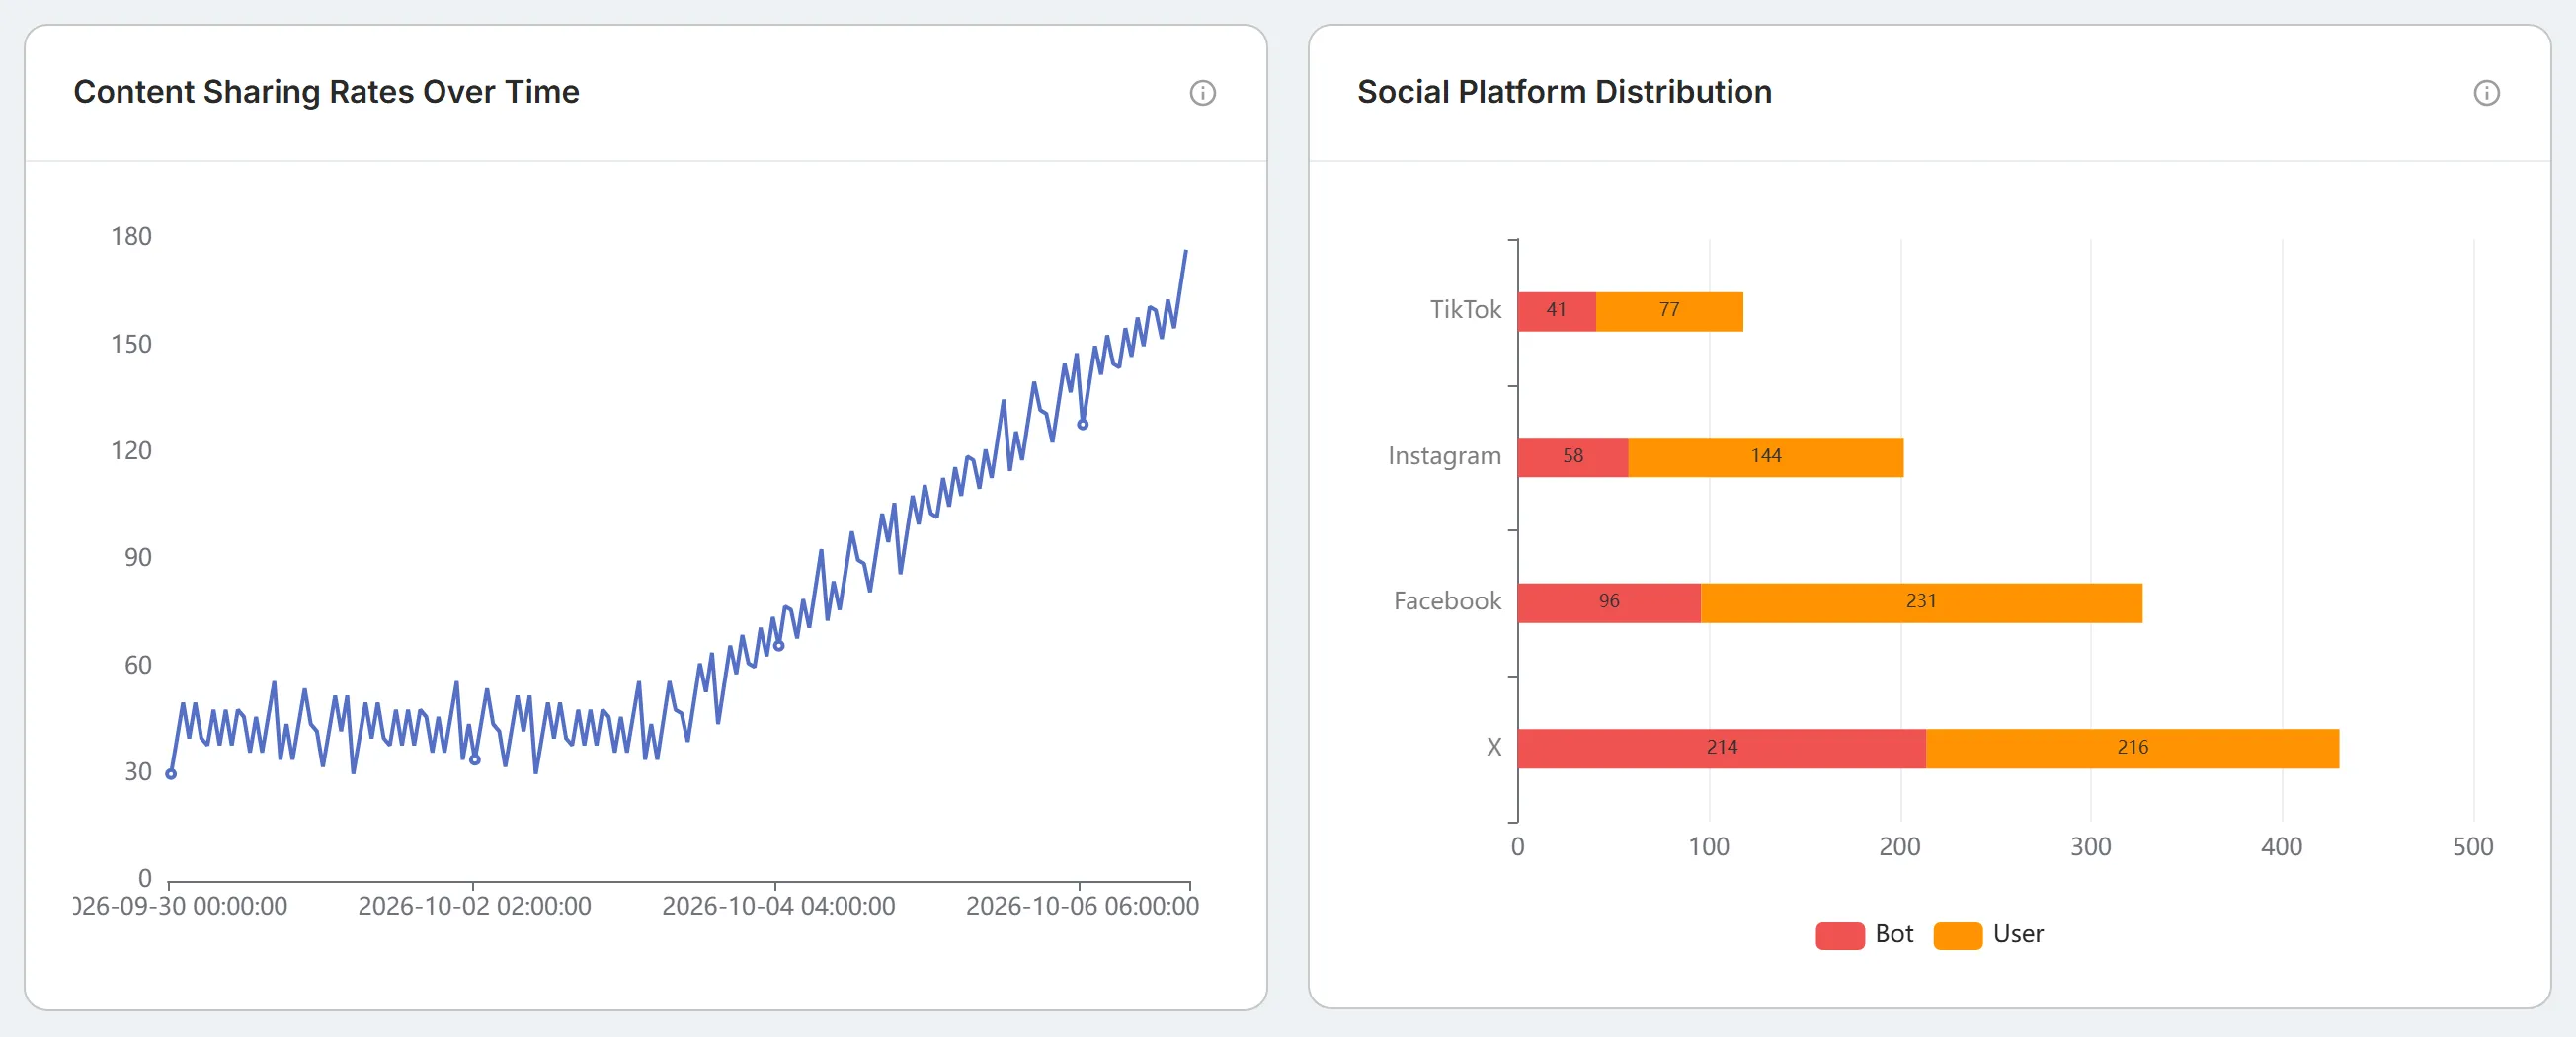
Section titled “Charts”- "Content Sharing Rates Over Time": how often content is reshared across the period, by hour. A steep, isolated spike suggests a coordinated push. Select a point to open "Content Sharing Rates", the posts from that hour.
- "Social Platform Distribution": posts per platform, split into "Bot" and "User". Select a bar to open "Platform Posts".
- "Geographical Distribution": where the posting accounts say they are, by post volume. Select a point to open "Location Posts". Location is self-declared and often blank or false, so treat it as a weak signal.
- "Bot / Human Influence": the reply and mention network around one post. Choose the post in "Post". Select an account in the network to open its "User" page. A post with no interactions shows "This post has no recorded interactions."
Post lists
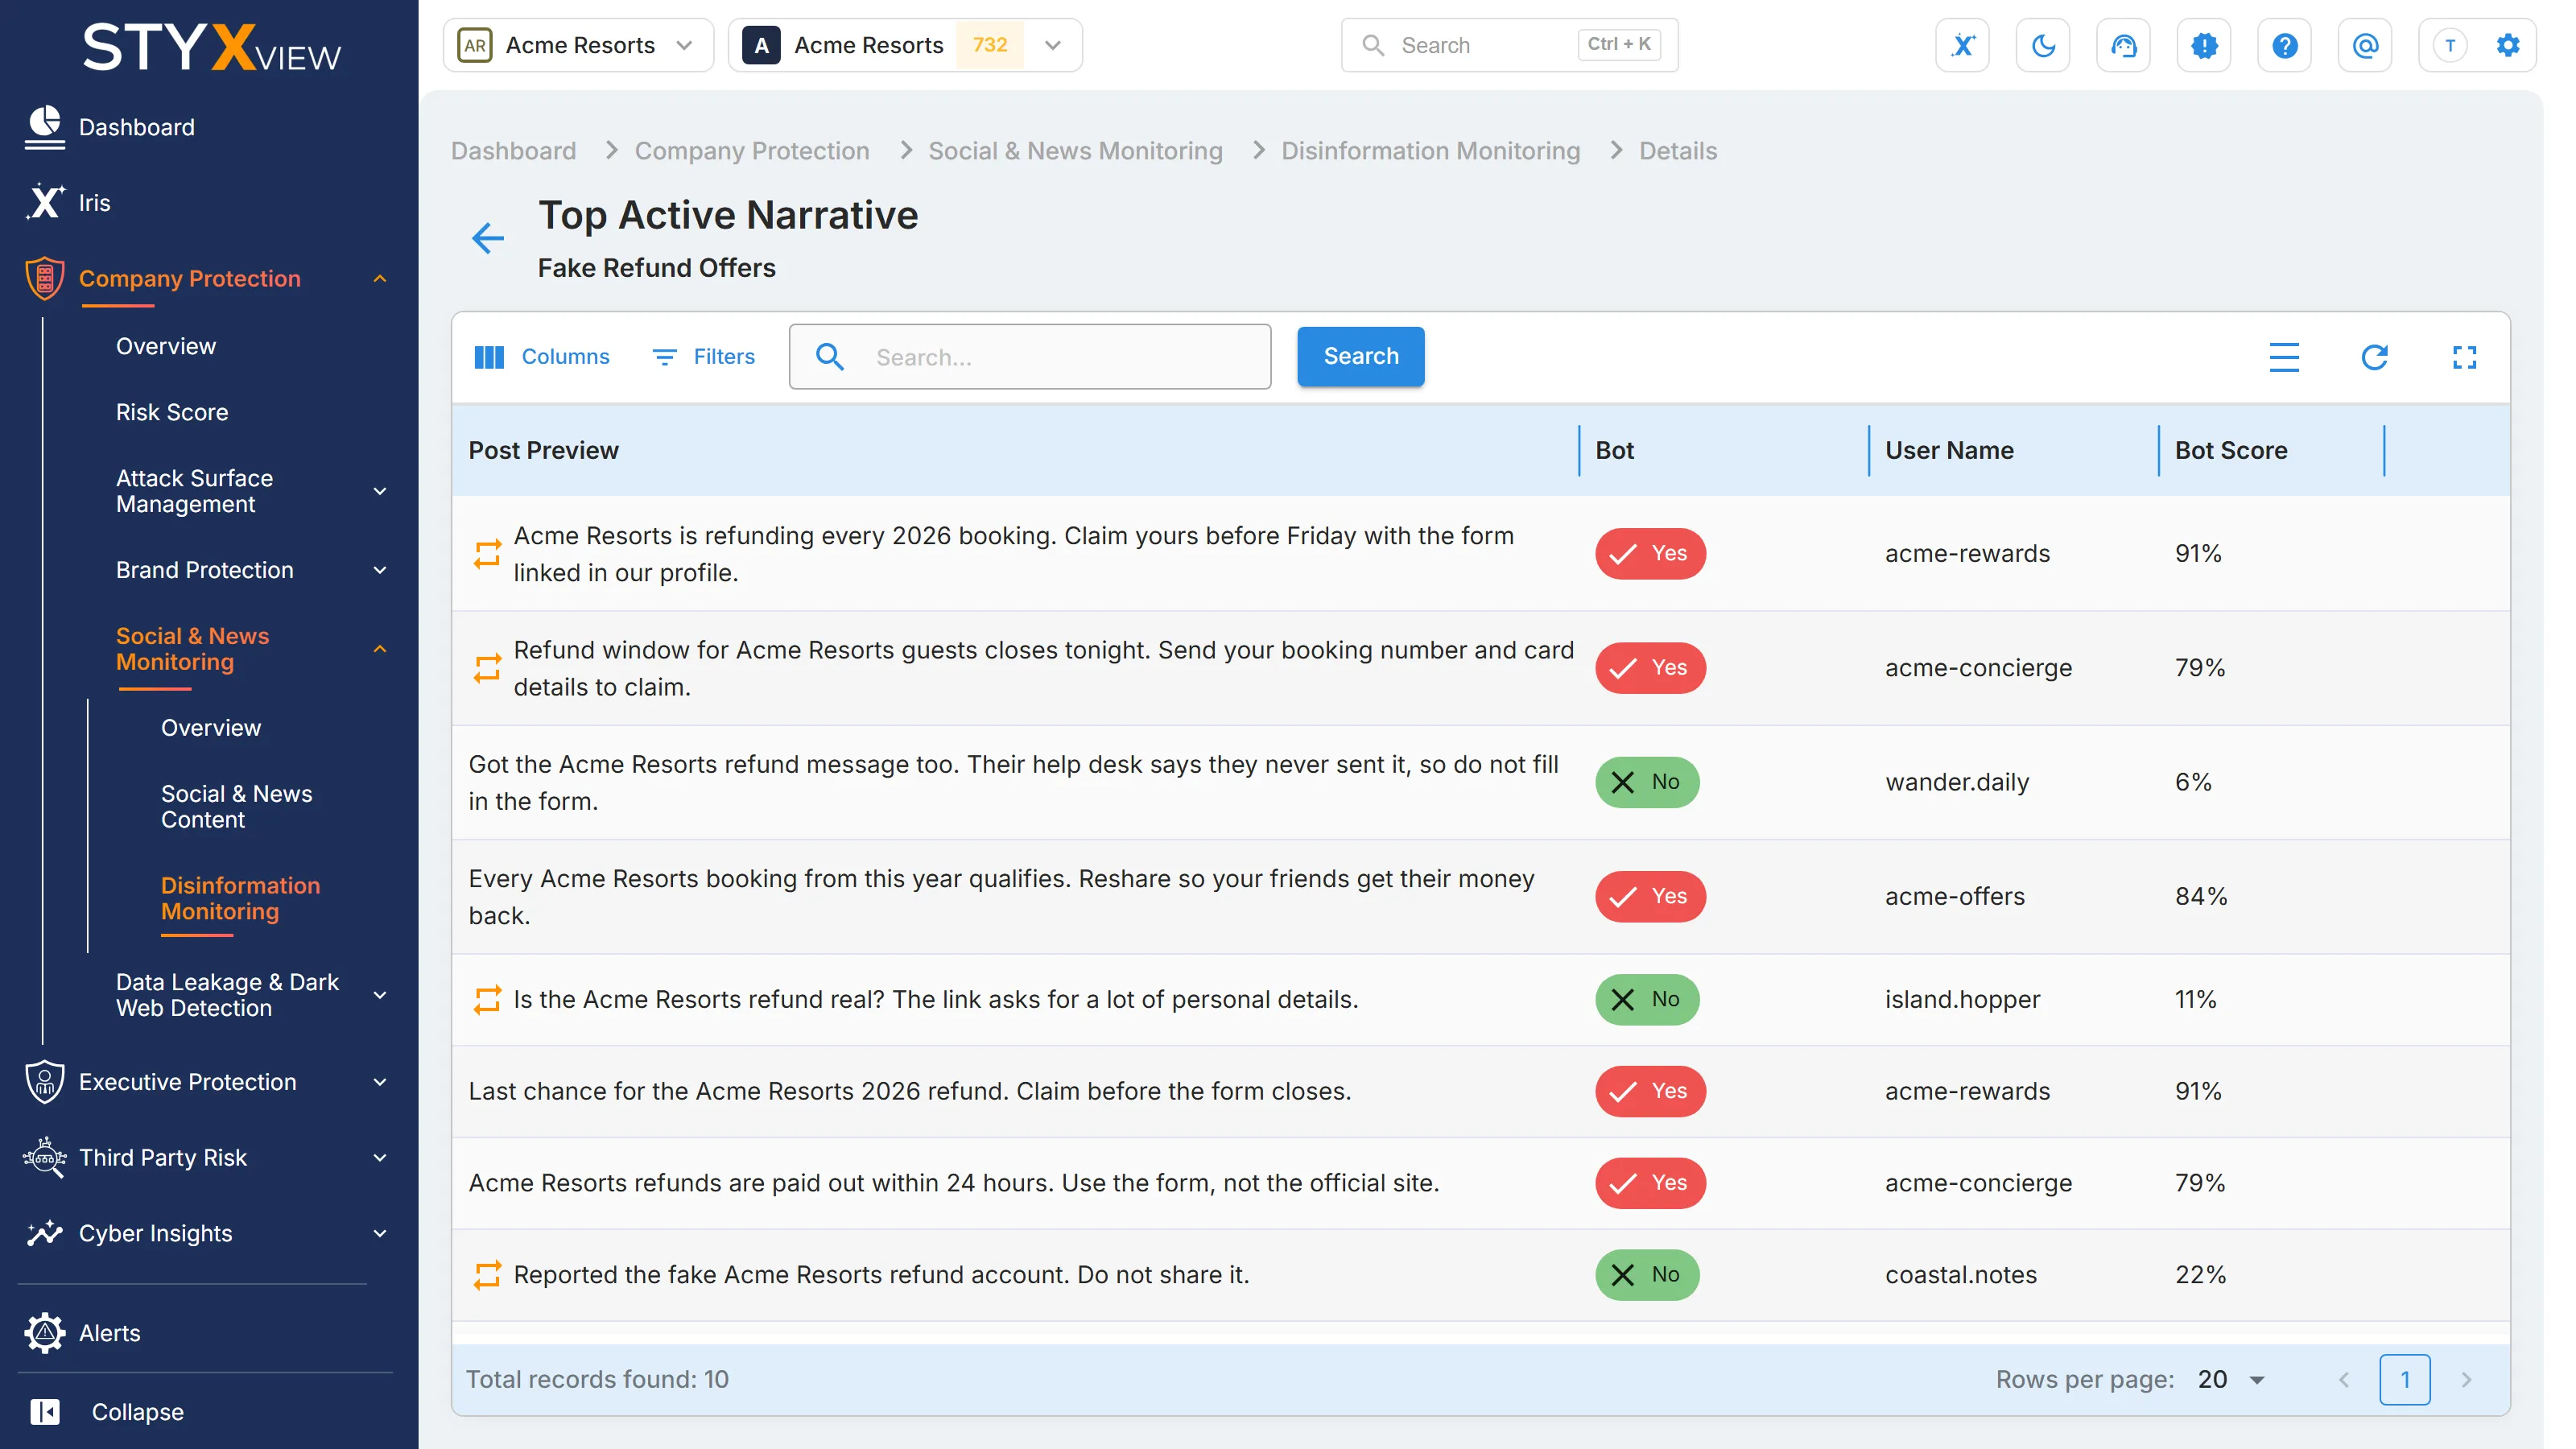
Section titled “Post lists”The lists opened from the page share these columns.
| Column | What it shows |
|---|---|
| Post Preview | The text of the post. Select it to open the post. |
| Bot | Whether the author is classified as automated. |
| User Name | The author. Select it to open the author's "User" page. |
| Bot Score | The likelihood that the author is automated, as a percentage. |
| URL | The post's address. |
| Sentiment | "Positive", "Neutral", or "Negative". |
| Likes | How many accounts liked the post. |
| Shares | How many times the post was reshared. |
| Comments | How many replies the post received. |
| Profanity | Profane words found in the post. |
| Threats | Threatening language found in the post. |
| Violence | Violent language found in the post. |
| Time Stamp | When the post was published. |
The "User" page lists every post by that author in the period, without the "Profanity", "Threats", and "Violence" columns.
The post page
Section titled “The post page”A post opens as "Social Media Post". "Details" shows its "Post Type", "Poster", "Language", "Topic Narrative", "URL", "Posted At", "Original Post", "Sentiment", "Fact Count", "Likes", "Shares", "Comments", and "Profanity Words". "Original Post" is "Yes" when the post is not a reshare.
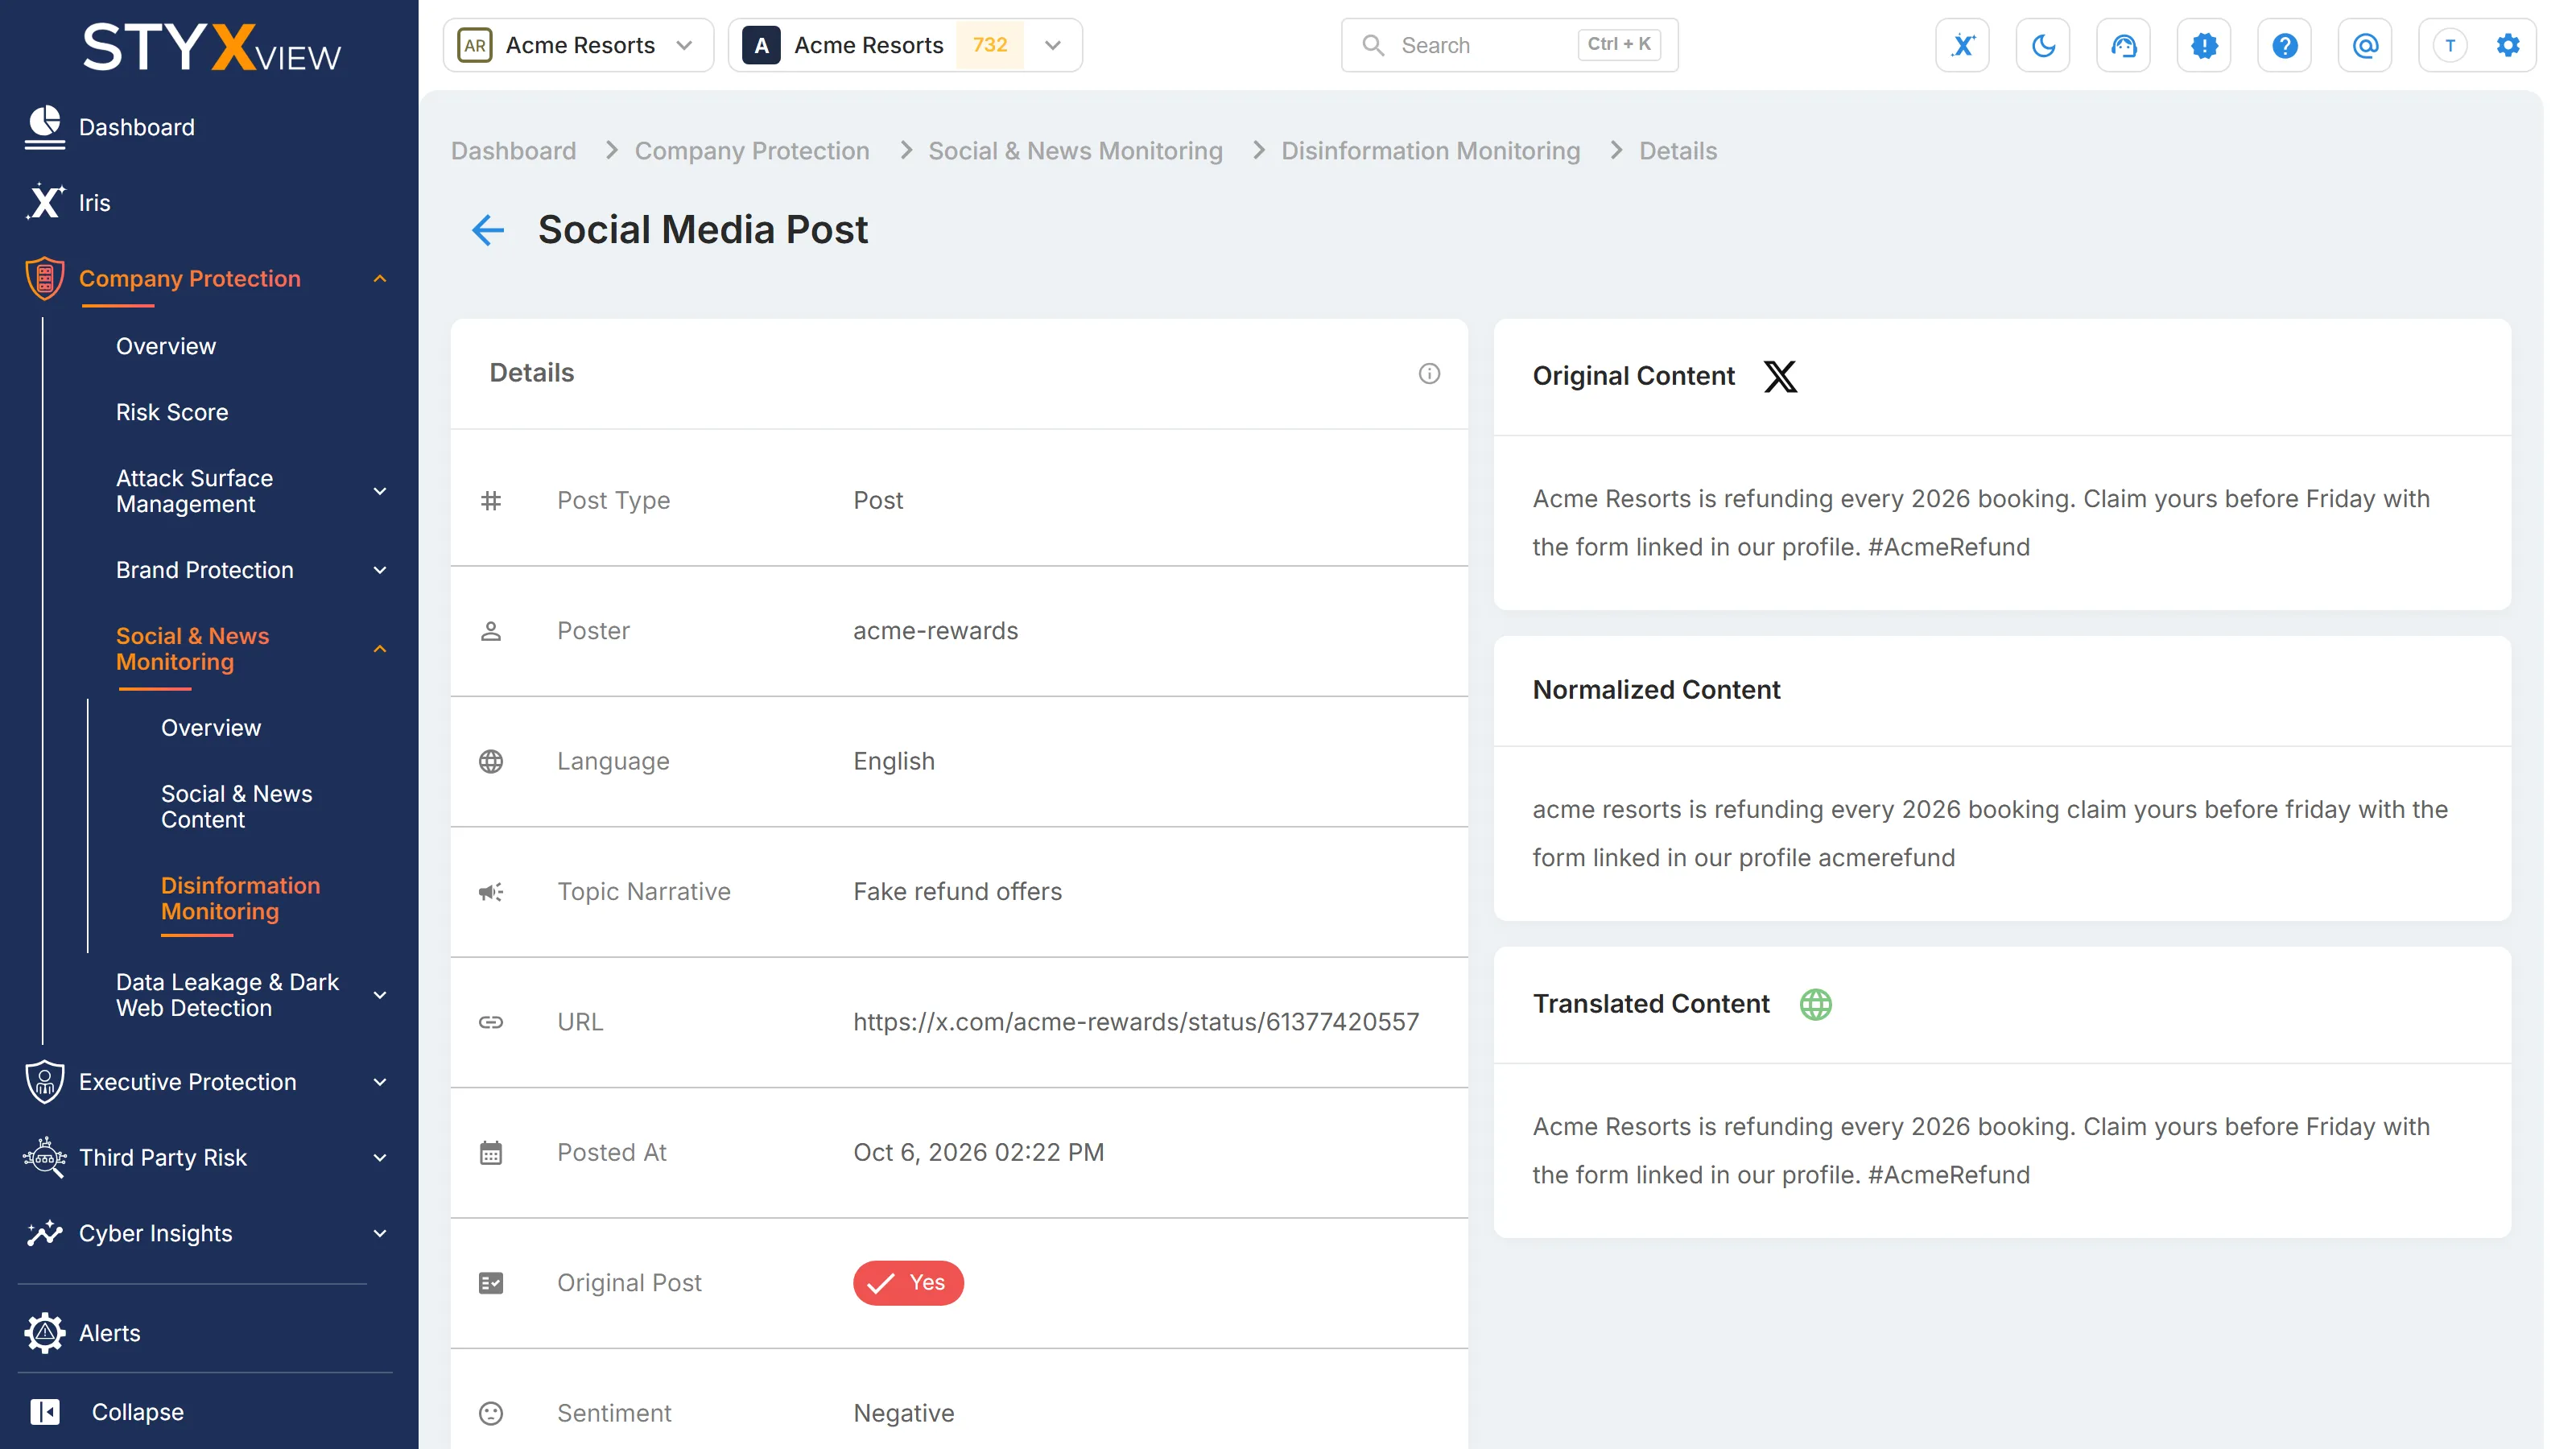
Next to the details are the post's "Original Content", its "Normalized Content", and its "Translated Content".
In Executive Protection
Section titled “In Executive Protection”Accounts with Disinformation Monitoring also see it in Executive Protection:
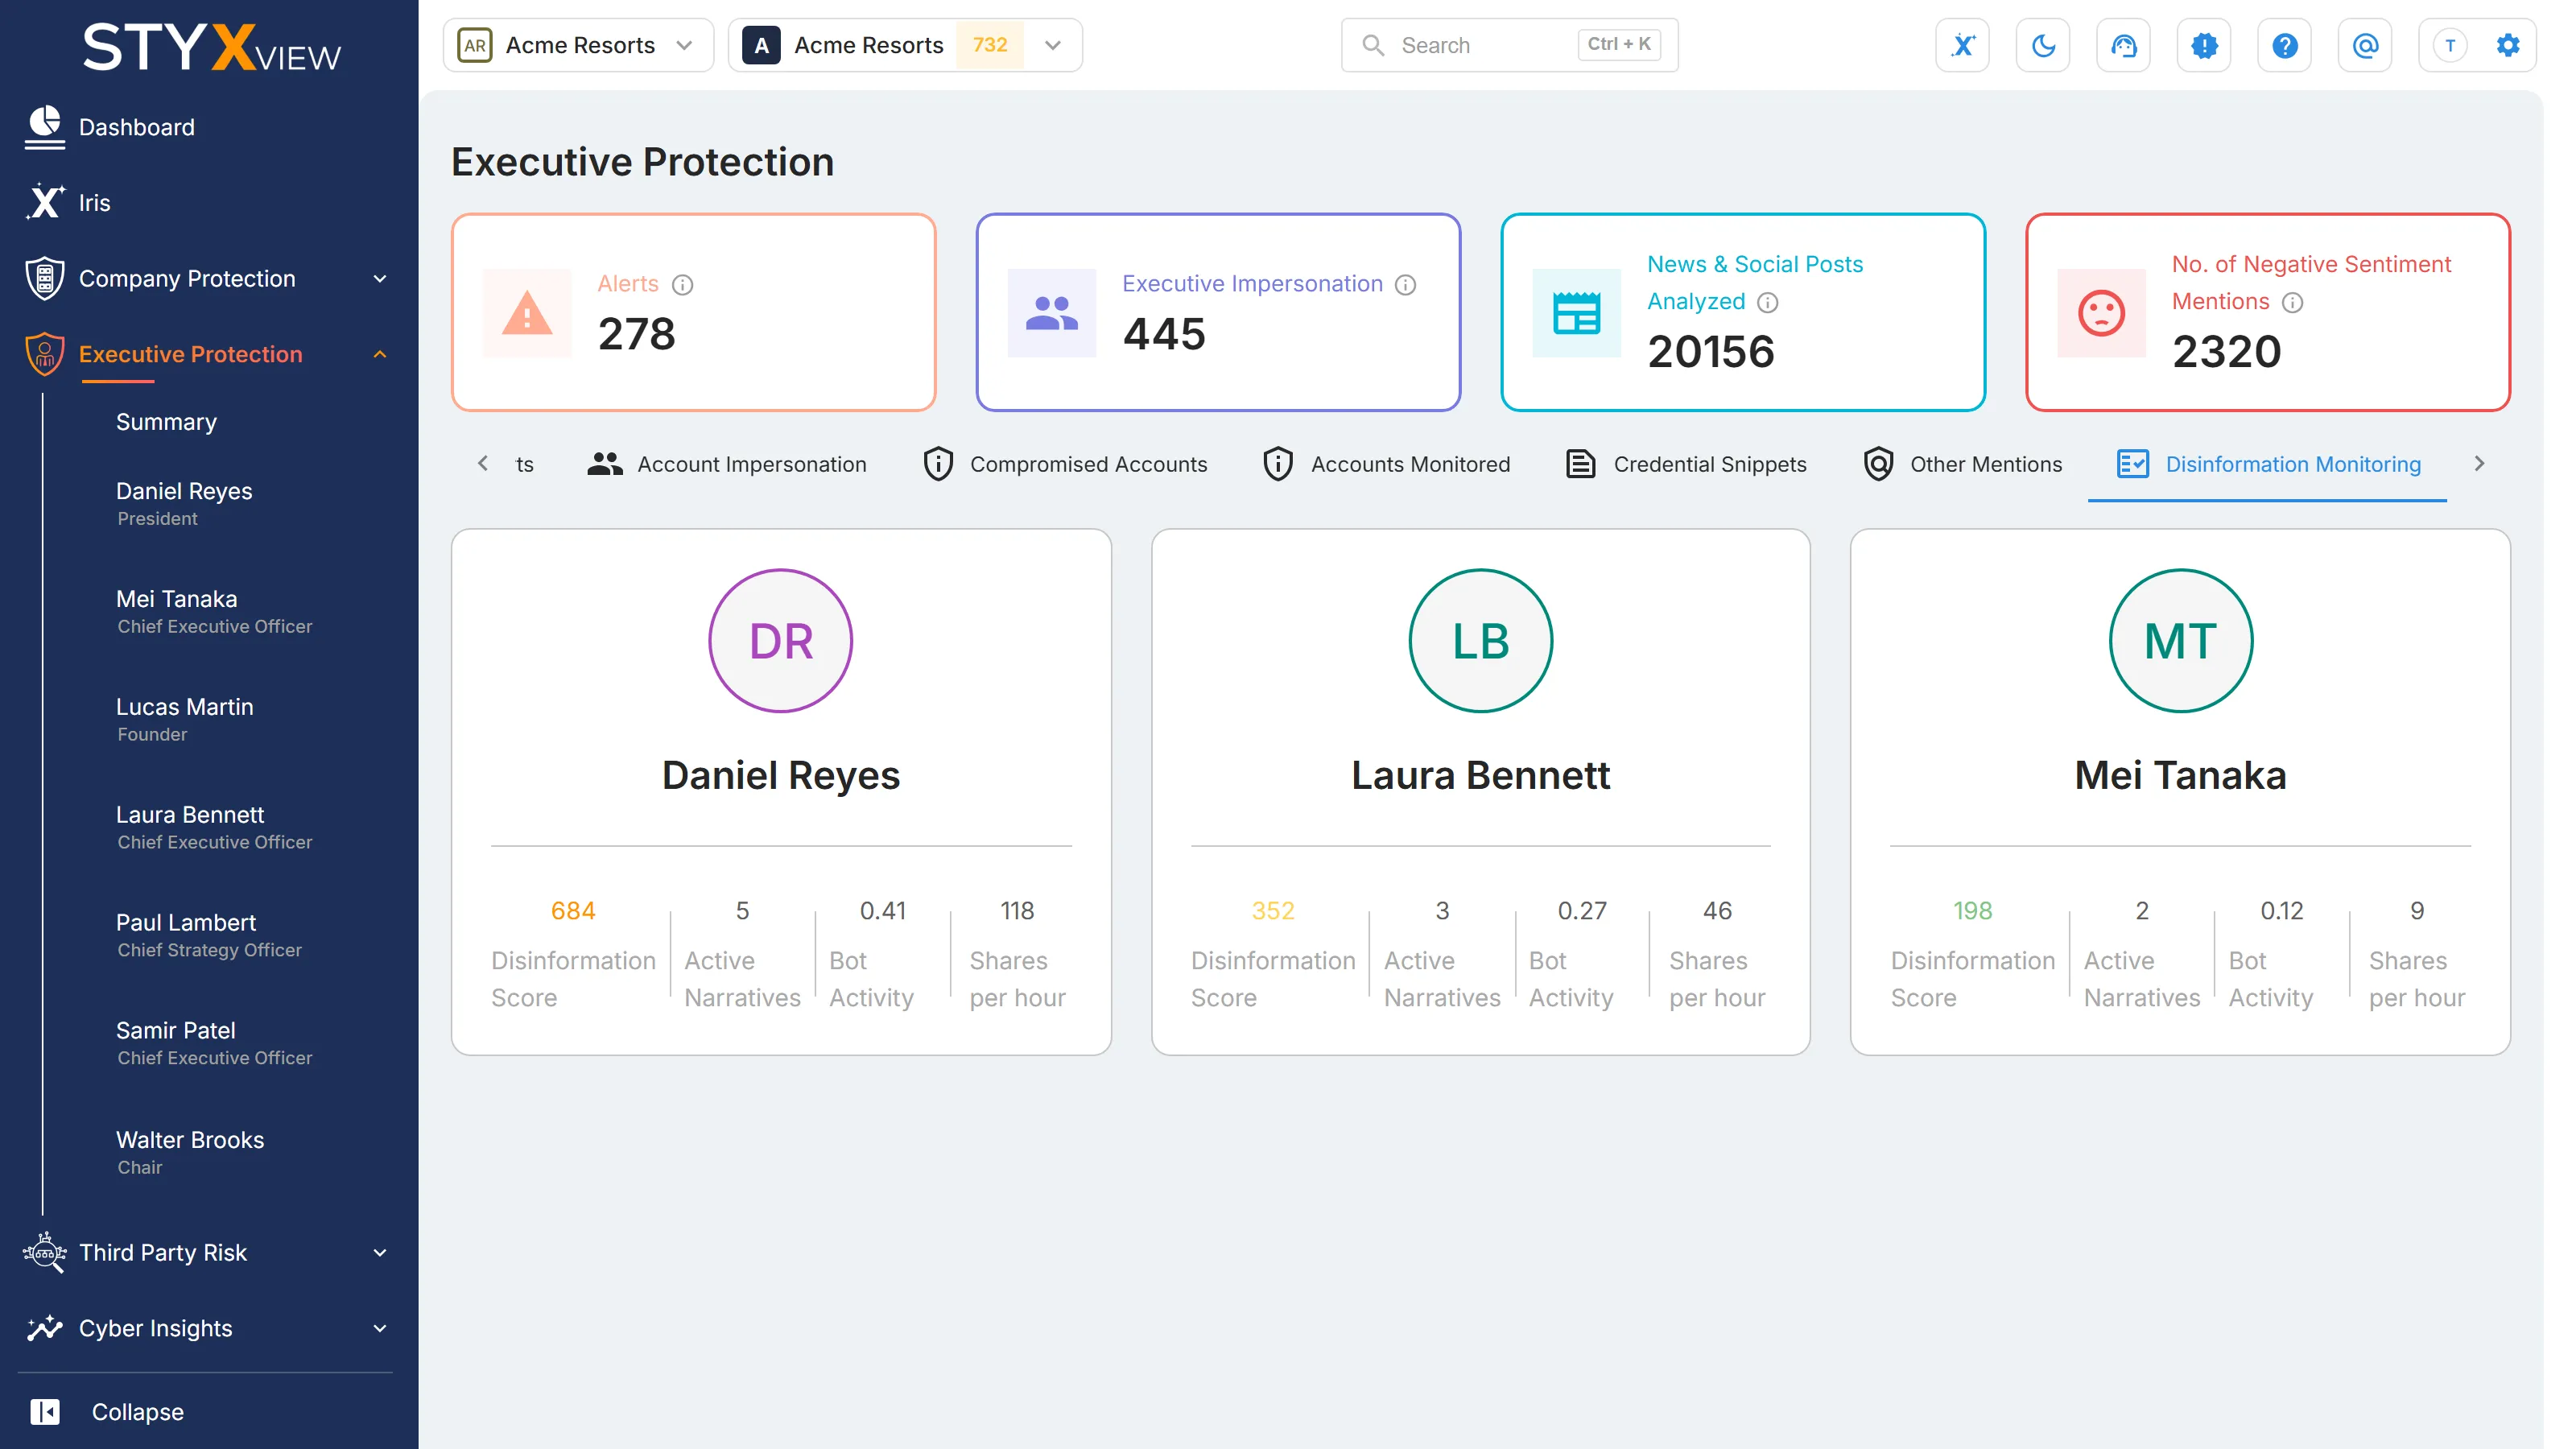
- "Executive Protection" > "Summary" > "Disinformation Monitoring" shows one card per executive with their "Disinformation Score", "Active Narratives", "Bot Activity", and shares per hour. Select the circle with an executive's initials to open their dashboard.
- Each executive's page has a "Disinformation Monitoring" tab with the same dashboard as this page, for that executive.
See Summary and Executive Profile.